
How to analyse call-centre-sentiments data using Python
Introduction
Customer service quality can make or break a company’s reputation. Call-centres are often at the frontline of customer interactions, making them a crucial component of customer satisfaction strategies.
To ensure that these interactions meet customer expectations, it’s essential to analyse and understand the factors that contribute to positive or negative experiences.
In this project, we delve into a dataset from a call centre and explore key metrics and uncover insights that can help improve call centre operations and ultimately enhance customer satisfaction.
Background of the call-centre dataset
This dataset originates from a call centre, focusing on customer interactions and feedback.
The data includes various attributes related to customer service experiences, such as customer satisfaction (CSAT) scores, sentiment analysis of the interactions, call details, and response times.
The primary purpose of this dataset is to assess the performance of the call centre and the quality of customer service.
The dataset for this analysis can be downloaded from this GitHub link and here. The Python code for the analysis can be downloaded here.
Potential Insights from the data
By analysing the data, one can identify areas for improvement, such as reducing response times, enhancing the efficiency of specific communication channels, and addressing factors that lead to negative sentiments and low CSAT scores.
The dataset is valuable for operational analysis, enabling the call centre management to make informed decisions on training, process optimisation, and resource allocation to enhance customer satisfaction and overall service quality.
Brief overview of key elements in the dataset
Customer Satisfaction (CSAT) Scores
A numerical measure (ranging from 1 to 10) that reflects the customer’s satisfaction with the service provided during the interaction.
Sentiment Analysis
The sentiment of each interaction is categorized as “Very Negative,” “Negative,” “Neutral,” “Positive,” or “Very Positive.”
This sentiment likely results from analysing the customer’s tone, language, and feedback during the call.
Call Details
Information such as the reason for the call (e.g., billing inquiries), the city and state of the customer, the channel through which the interaction occurred (e.g., Call-Centre, Chatbot, Web), and the call duration in minutes.
Response Time
Indicates whether the call was responded to within the Service Level Agreement (SLA), below the SLA, or if the issue was escalated or above SLA. This is crucial for understanding the efficiency of the service provided.
Call Centre Location
The geographical location of the call centre handling the interaction, which could be important for identifying regional performance trends.
Exploratory Data Analysis (EDA)
The EDA will include:
- Summary Statistics: General statistical overview of the numerical and categorical variables.
- Distribution Analysis: Understanding the distribution of key numerical variables.
- Sentiment Analysis: Breakdown of sentiments and their relationship with other variables.
- Channel and Response Time Analysis: Analysing how different channels and response times impact the CSAT scores and sentiments.
Summary Statistics
Numerical Summary Statistics
Column | Count | Mean | Std | Min | Max |
CSAT Score | 70 | 5.32 | 2.38 | 1 | 10 |
Call Duration (Minutes) | 70 | 26.25 | 12.57 | 6 | 45 |
- There is a wide range of customer satisfaction scores, with a mean score at approximately 5 minutes.This indicates that the distribution might be somewhat balanced but leans slightly towards the lower end.
- The call durations also have a wide range, indicating that a significant number of calls are longer in duration.
Categorical Summary Statistics
Column | Unique | Top | Frequency |
ID | 70 | PIS-39858047 | 1 |
Customer Name | 70 | Frances Gullefant | 1 |
Sentiment | 5 | Negative | 29 |
Reason | 3 | Billing Question | 50 |
City | 57 | Minneapolis | 3 |
State | 29 | Texas | 9 |
Channel | 4 | Call-Centre | 23 |
Response Time | 3 | Within SLA | 53 |
Call Centre | 4 | Los Angeles/CA | 30 |
- There are 5 unique sentiments, with “Negative” being the most common, occurring 29 times. This suggests a potential area of concern for the call centre.
- The most frequent reason for calls is “Billing Question” (50 out of 70 entries), indicating that billing issues are a primary driver for customer inquiries.
- The most common channel is “Call-Centre” (23 occurrences), followed by “Chatbot”.
- Most of the calls fall “Within SLA” (53 out of 70), with fewer calls being “Below SLA” or categorized as “Escalated”.
- The “Los Angeles/CA” call centre handled the most interactions (30 out of 70), indicating it is a major hub.
Distribution Analysis
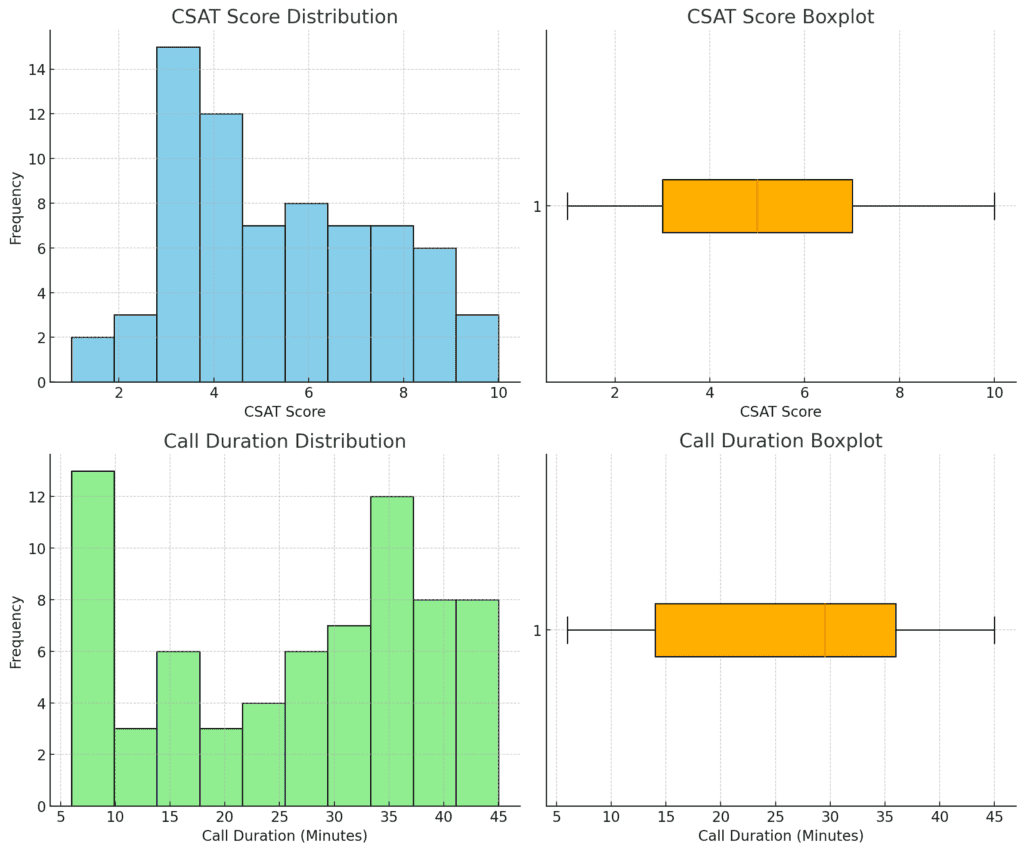
CSAT Score Distribution
The histogram reveals that the CSAT scores are somewhat evenly distributed but with a slight skew towards lower scores.
The boxplot shows that there are no outliers, and the middle 50% of the data (interquartile range) is spread across a wide range, indicating diverse customer satisfaction levels.
Call Duration Distribution
The histogram indicates that most calls are concentrated in the 20–40-minute range, with fewer calls being significantly shorter or longer.
The boxplot shows that there are a few calls on the longer end that might be considered outliers, but they are not extreme.
Sentiment Analysis
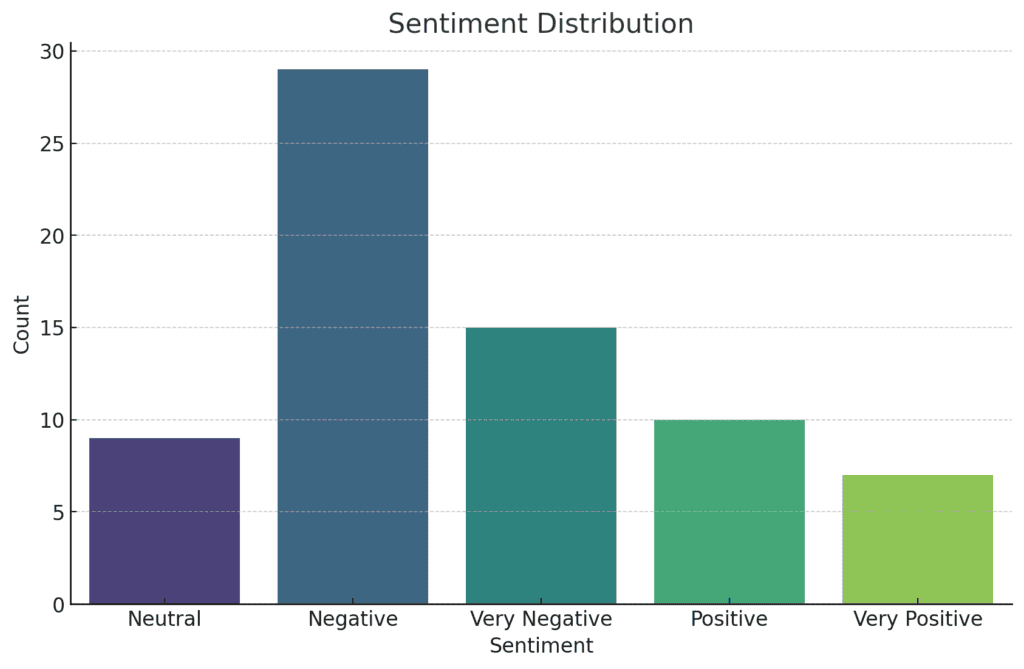
Sentiment Distribution
The bar plot shows that “Negative” sentiment is the most frequent, followed by “Positive” and “Neutral”.
“Very Negative” and “Very Positive” sentiments are the least common.
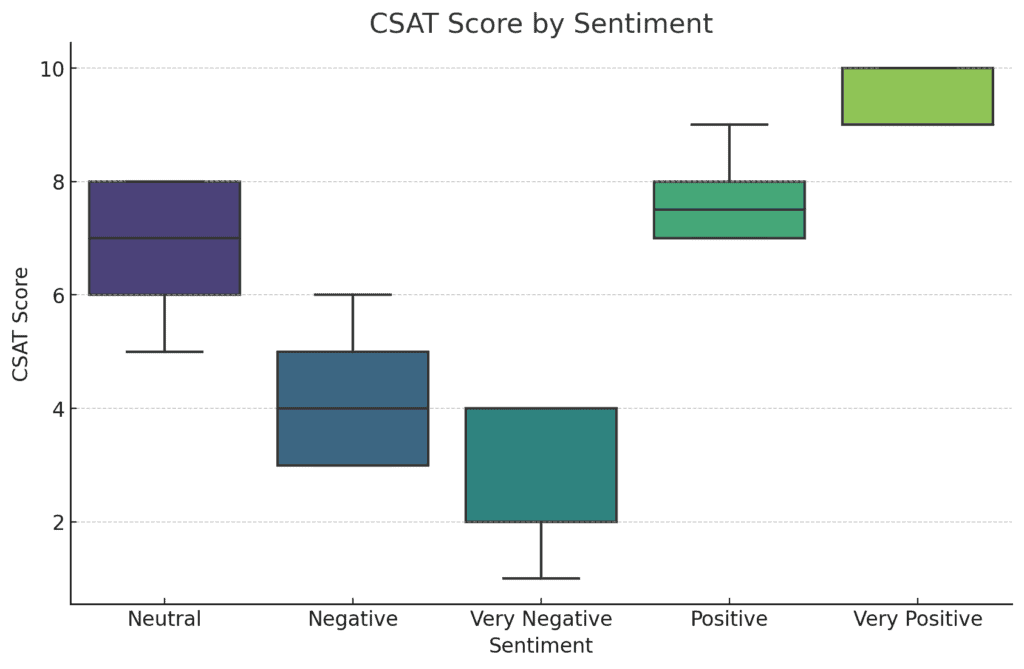
CSAT Score by Sentiment
The boxplot illustrates a clear relationship between sentiment and CSAT scores.
As expected, “Very Positive” sentiment corresponds with higher CSAT scores, while “Very Negative” correlates with the lowest scores.
This trend reinforces the reliability of the sentiment analysis in reflecting customer satisfaction.
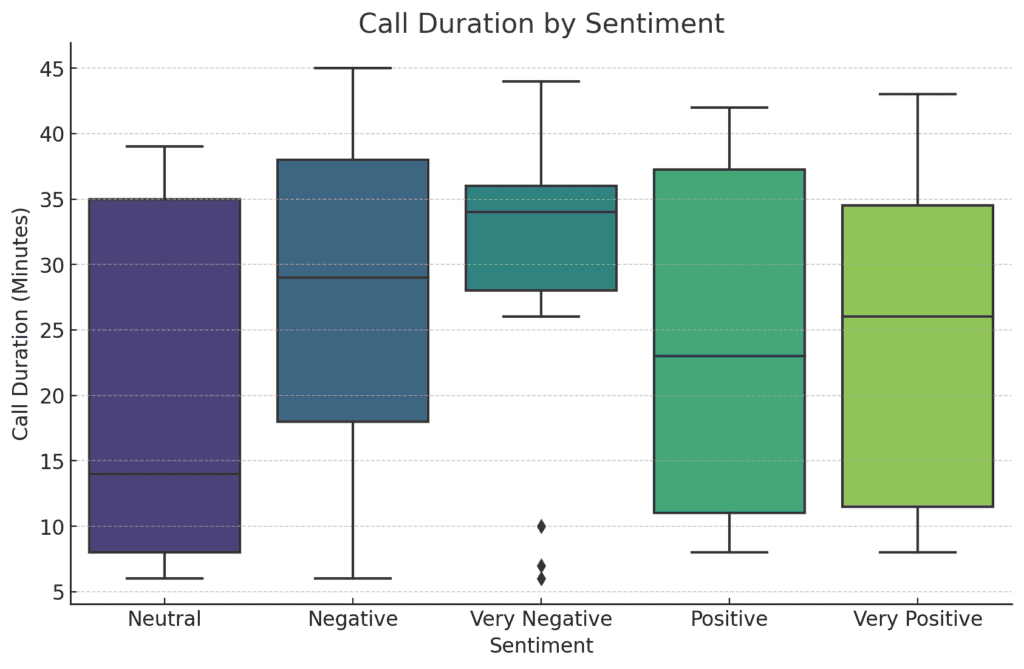
Call Duration by Sentiment
The boxplot for call duration reveals that calls associated with “Very Negative” sentiment tend to be longer, which could indicate more complex issues or dissatisfaction leading to prolonged conversations.
In contrast, “Neutral” and “Positive” sentiments tend to have shorter call durations.
Channel and Response Time
CSAT Score by Channel
The boxplot shows that CSAT scores vary across different communication channels. The “Call-Centre” channel has the widest range of scores, including the lowest scores, indicating potential dissatisfaction.
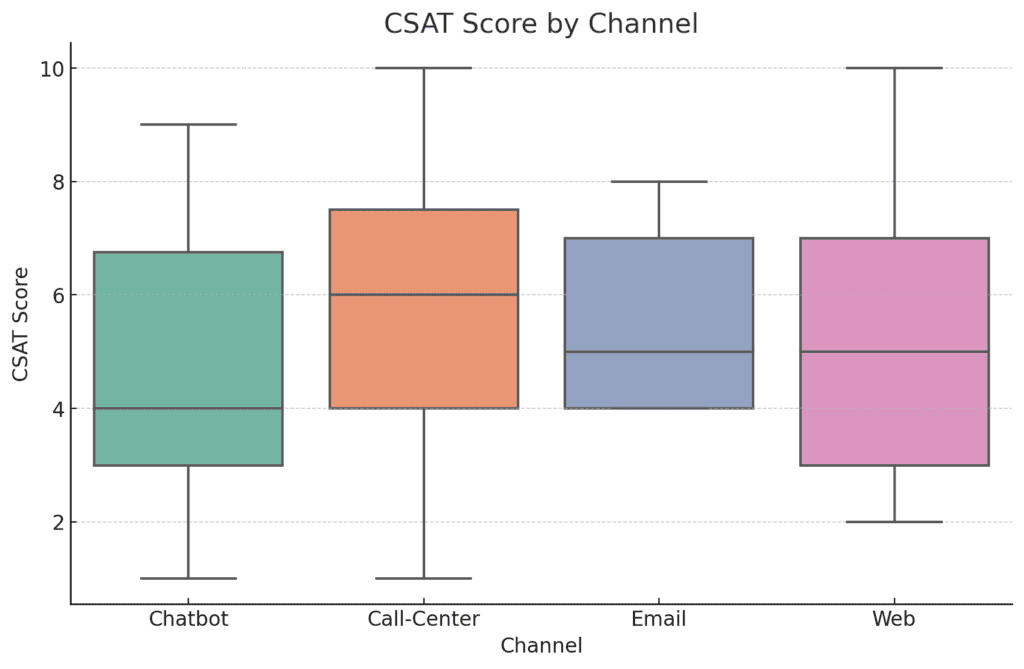
In contrast, the “Web” channel has more consistent and higher CSAT scores, suggesting better experiences through this channel.
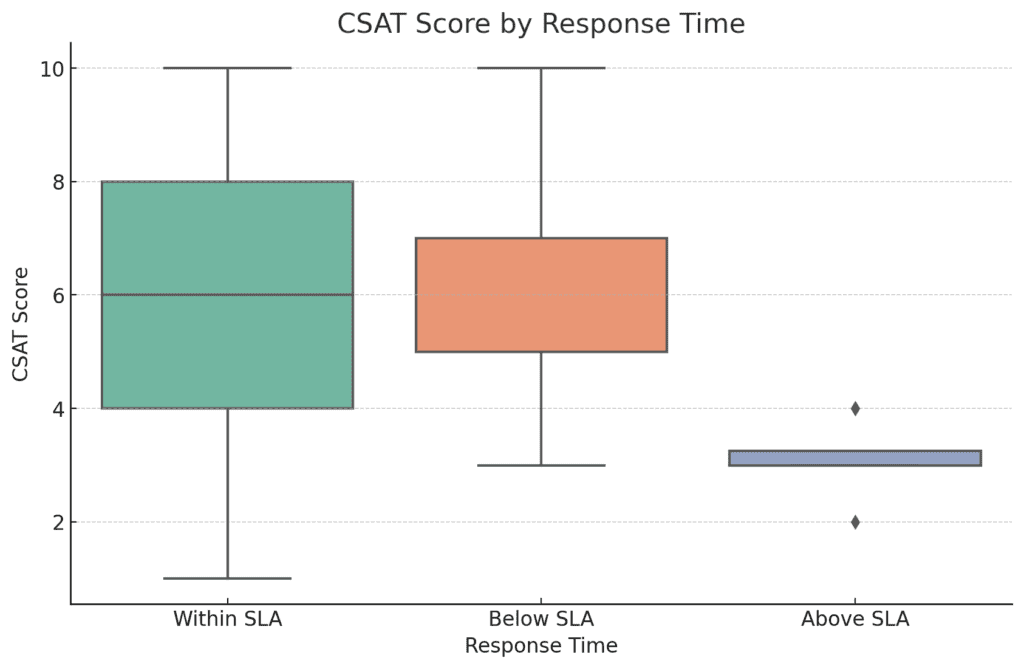
CSAT Score by Response Time
The CSAT scores are generally higher for interactions that occurred “Within SLA,” compared to those classified as “Below SLA” or “Escalated.”
This underscores the importance of timely responses in maintaining customer satisfaction.
Sentiment Distribution by Channel
The count plot shows that negative sentiments are more frequent in the “Call-Centre” and “Chatbot” channels.
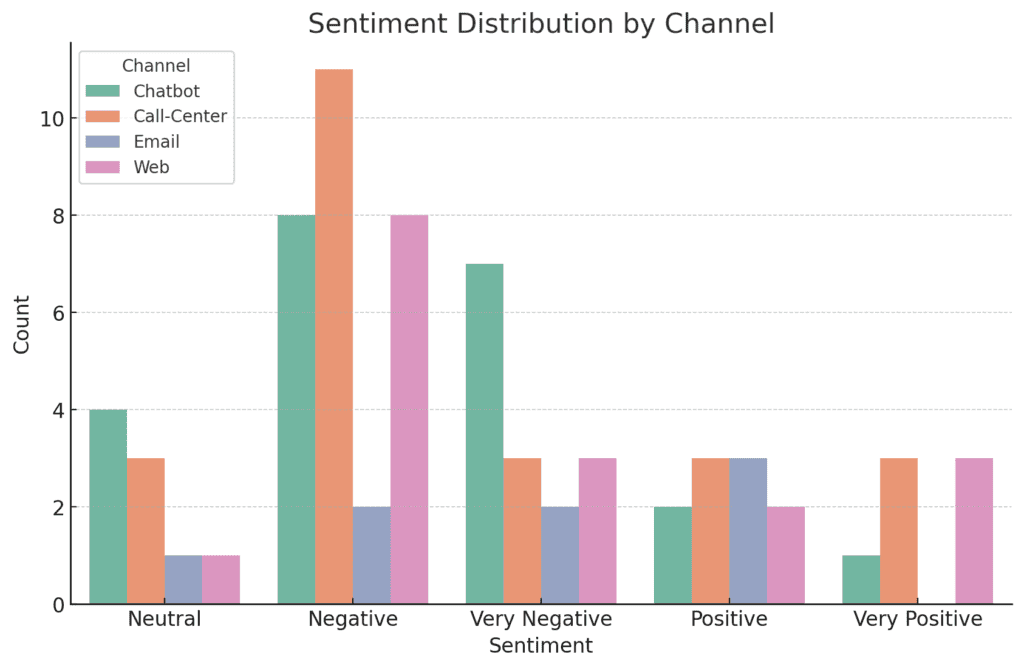
This could indicate challenges with these channels that are leading to customer dissatisfaction.
The “Web” channel, in contrast, has a higher proportion of positive sentiments.
Further Analysis
Correlation Analysis: Call Duration, Sentiment, and CSAT Scores
Let’s quantify the relationships between call duration, sentiment, and CSAT scores. We’ll encode the sentiment variable numerically to perform correlation analysis.
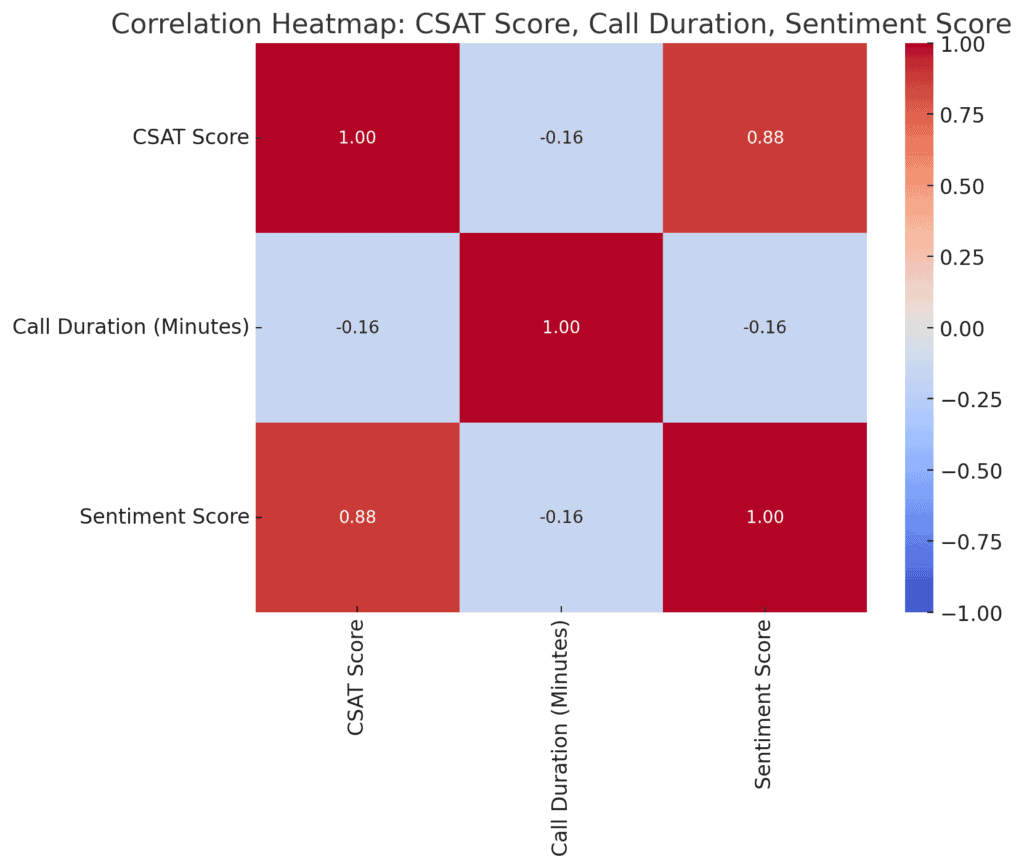
- CSAT Score and Sentiment Score: The correlation between CSAT scores and sentiment scores is 0.88, indicating a strong positive relationship.
As sentiment improves (from “Very Negative” to “Very Positive”), the CSAT score tends to increase significantly.
- CSAT Score and Call Duration: The correlation between CSAT scores and call duration is -0.16, indicating a weak negative relationship.
This suggests that longer calls might slightly decrease customer satisfaction, but the effect is not strong.
- Sentiment Score and Call Duration: The correlation between sentiment scores and call duration is -0.16, which is also a weak negative relationship.
This implies that longer call durations may be associated with slightly more negative sentiments, though the effect is not pronounced.
In summary, the heatmap highlights the strong positive correlation between CSAT Score and Sentiment Score, and the weak negative correlations involving Call Duration.
Patterns in Delayed Response Time
The analysis of response times shows the following key insights:
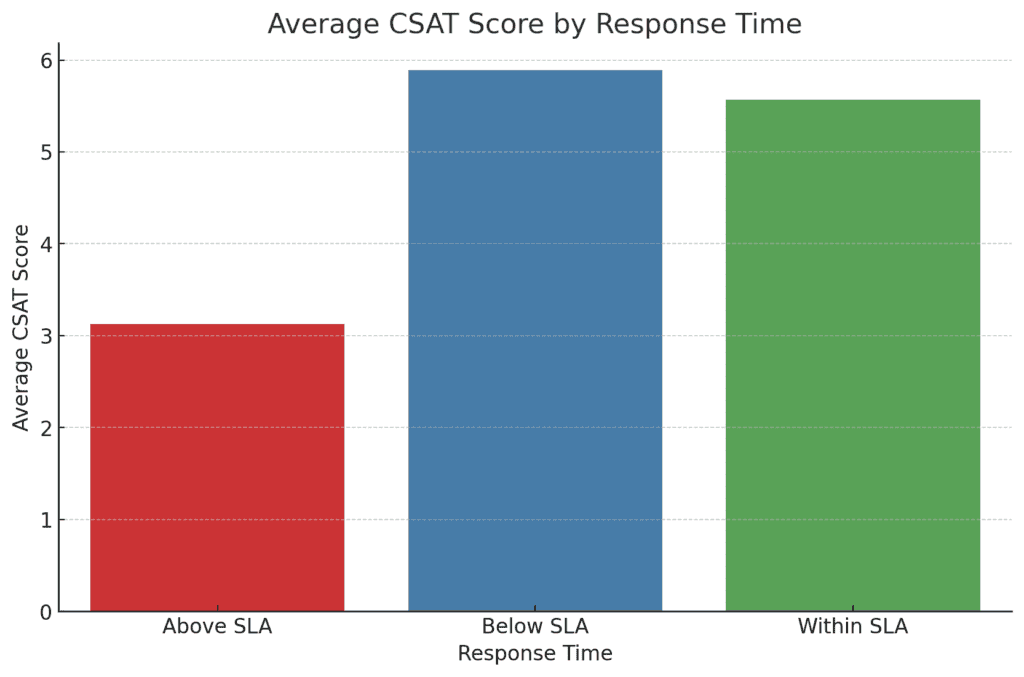
- Average CSAT Score by Response Time: This bar plot shows that the CSAT scores are significantly lower for calls with “Above SLA” response times compared to those “Within SLA”..
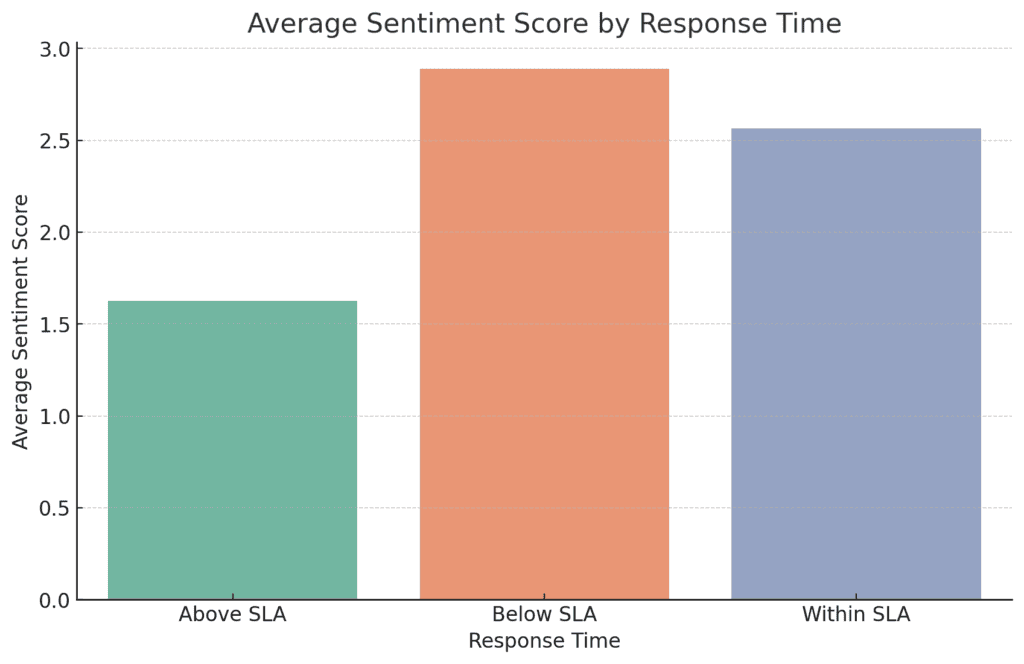
- Average Sentiment Score by Response Time: Similar to the CSAT scores, the sentiment scores are also lowest for “Above SLA” and slightly better for “Below SLA” compared to “Within SLA”.
- Average Call Duration by Response Time: This plot reveals that calls with “Above SLA” response times have the longest durations, while those “Within SLA” have shorter durations, indicating more efficient handling
Time-Series Analysis of Sentiments and CSAT Scores
The time-series plot reveals the following trends:
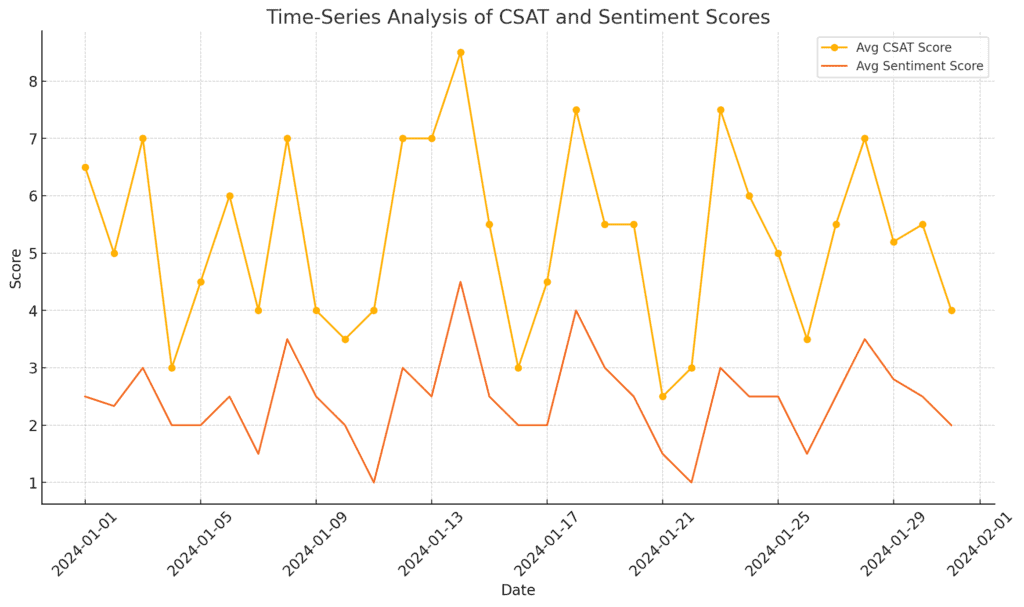
- CSAT Score: There is some variability in average CSAT scores over time, but no clear upward or downward trend.
The scores fluctuate, suggesting that customer satisfaction might be influenced by specific events or issues rather than a consistent trend.
- Sentiment Score: Similar to the CSAT score, the sentiment score also shows fluctuations over time.
The sentiment trends closely mirror the CSAT score trends, which is expected given the strong correlation between these two variables.
Summary and recommendations
Based on the analyses, here are some actionable insights:
- Focus on Reducing Call Duration: Since longer calls are associated with negative sentiments and lower CSAT scores, it may be beneficial to identify the causes of prolonged calls and address them, perhaps through better training or more efficient processes.
- Improve Channels with Lower Satisfaction: The “Call-Centre” and “Chatbot” channels have lower satisfaction levels. Investigating the issues specific to these channels (e.g., script limitations, response delays) could lead to significant improvements.
- Prioritise SLA Compliance: Ensuring that calls are handled “Within SLA” is crucial for maintaining customer satisfaction. It would be beneficial to focus on the factors causing delays and address them to improve overall performance.
- Monitor Trends and Investigate Fluctuations: Regular monitoring of CSAT and sentiment trends is essential to quickly identify and address periods of declining customer satisfaction.
Specific events or changes during periods of fluctuation should be investigated further.
Conclusion
The analysis of the call centre dataset highlights several critical factors influencing customer satisfaction.
We observed strong correlations between sentiment and CSAT scores, confirming that positive experiences align with higher satisfaction.
In addition, response times play a significant role in customer perceptions, with delays leading to lower satisfaction and more negative sentiments.
The findings suggest that reducing call durations, particularly for issues leading to escalations, and improving the efficiency of channels like the Call-Centre and Chatbot, are key areas for improvement.