How to analyse Electric Vehicles adoption rates using Python
Introduction
The automotive industry is undergoing a profound transformation, with electric vehicles (EVs) at the forefront of this revolution.
As governments, consumers, and manufacturers alike recognise the environmental and economic benefits of EVs, adoption rates are soaring, especially in forward-thinking regions like Washington State.
This project delves into a comprehensive analysis of EV adoption trends in Washington State, using the most recent dataset.
We’ll explore how different factors such as vehicle type, make, and model influence adoption rates, and examine how these trends are shaping the future of mobility in the state.
Brief overview of Electric Vehicles (EVs)
Electric vehicles (EVs) are powered by one or more electric motors, driving their propulsion.
These vehicles can draw power either from an external electricity source or from an onboard battery, which can be recharged through solar panels, fuel cells, or generators.
EVs encompass a wide range of transportation modes, including road and rail vehicles, watercraft, aircraft, and even spacecraft.
With regards to road transportation, EVs play an important role in the broader vision of Connected, Autonomous, Shared, and Electric (CASE) Mobility, alongside advancements in autonomous driving, vehicle connectivity, and shared mobility services.
Outline of EVs dataset
The dataset for this project contains detailed information on Battery Electric Vehicles (BEVs) and Plug-in Hybrid Electric Vehicles (PHEVs) registered in Washington State in 2024.
It is composed of 181,458 entries and 17 columns.
The dataset for this analysis can be downloaded from kaggle. The Python code for the analysis can be downloaded here.
Here’s a summary of the key columns in the dataset:
- VIN (1-10): Partial Vehicle Identification Number.
- County: The county where the vehicle is registered.
- City: The city where the vehicle is registered.
- State: State (all entries are for Washington – WA).
- Postal Code: Postal code for the vehicle registration.
- Model Year: The year the vehicle model was manufactured.
- Make: The manufacturer of the vehicle (e.g., TESLA, AUDI).
- Model: The specific model of the vehicle.
- Electric Vehicle Type: Specifies whether the vehicle is a Battery Electric Vehicle (BEV) or a Plug-in Hybrid Electric Vehicle (PHEV).
- Clean Alternative Fuel Vehicle (CAFV) Eligibility: Indicates whether the vehicle is eligible for clean alternative fuel vehicle benefits.
- Electric Range: The electric-only range of the vehicle in miles.
- Base MSRP: The Manufacturer’s Suggested Retail Price at the base level (this is set to 0 for most of the entries).
- Legislative District: The legislative district where the vehicle is registered.
- DOL Vehicle ID: Unique identifier for the vehicle in the Department of Licensing system.
- Vehicle Location: The geographic coordinates (latitude and longitude) of the vehicle’s registration location.
- Electric Utility: The electricity provider for the vehicle’s location.
- 2020 Census Tract: The census tract for the vehicle’s registration location.
Step-by-Step analysis of the EVs dataset
1. Initial Exploratory Data Analysis (EDA)
The dataset contains some missing values in the following columns:
- County: 3 missing values
- City: 3 missing values
- Postal Code: 3 missing values
- Legislative District: 398 missing values
- Vehicle Location: 8 missing values
- Electric Utility: 3 missing values
- 2020 Census Tract: 3 missing values
These missing values are relatively few compared to the total number of records.
However, the high number of missing values in the Legislative District column is notable and may require special handling depending on the analysis.
Summary Statistics
Summary statistics for relevant columns show:
Metric | Model Year | Electric Range | Base MSRP |
Count | 181,458 | 181,458 | 181,458 |
Mean | 2020.58 | 57.83 miles | $1,040.24 |
Std Deviation | 2.99 | 91.40 miles | $8,228.99 |
Minimum | 1997 | 0 miles | $0 |
Maximum | 2024 | 337 miles | $845,000 |
2. Detailed Data Analysis
Analysis of Electric Vehicle Adoption Over Time
Understanding trends in EV adoption can indicate how quickly the market is growing and which years saw significant increases.
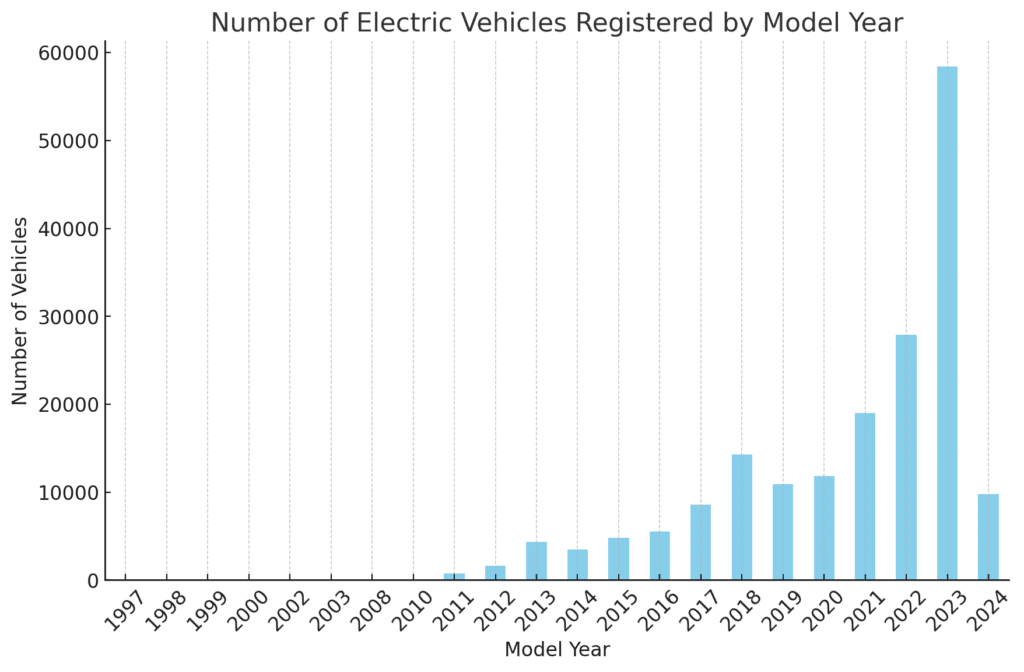
The bar chart shows the number of electric vehicles registered by model year.
There is a noticeable upward trend in EV registrations, particularly in the most recent years, indicating growing adoption of electric vehicles over time.
The spike in registrations in the latest years reflects increased consumer interest and perhaps better availability of EV models.
Distribution of Electric Vehicles by County
Geographic distribution provides insights into which areas are adopting EVs more rapidly.
The bar chart now shows the distribution of electric vehicles across the top 20 counties in Washington State.
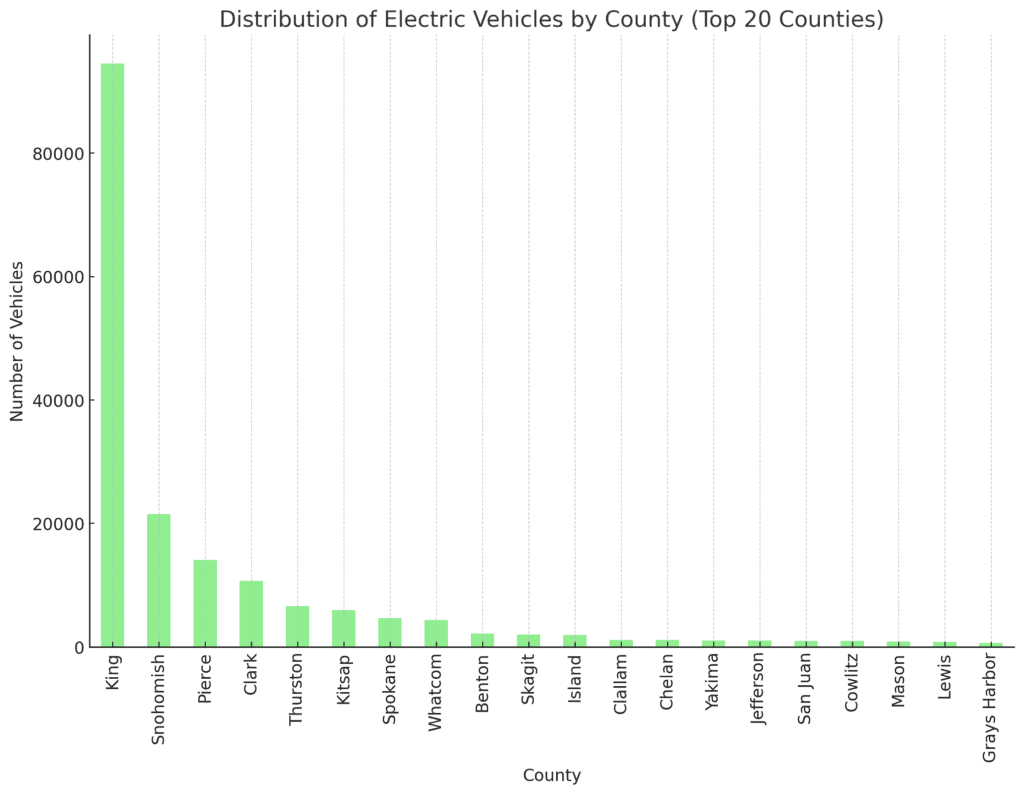
This provides a more detailed view of where EV adoption is concentrated, with King County leading by a significant margin, followed by other populous counties such as Snohomish, Pierce, and Clark.
This visualisation highlights the regions with the highest levels of EV adoption, which are typically more urbanised areas.
Electric Range Analysis
The electric range influences user experience and adoption rates. Comparing ranges between BEVs and PHEVs will highlight their differences.
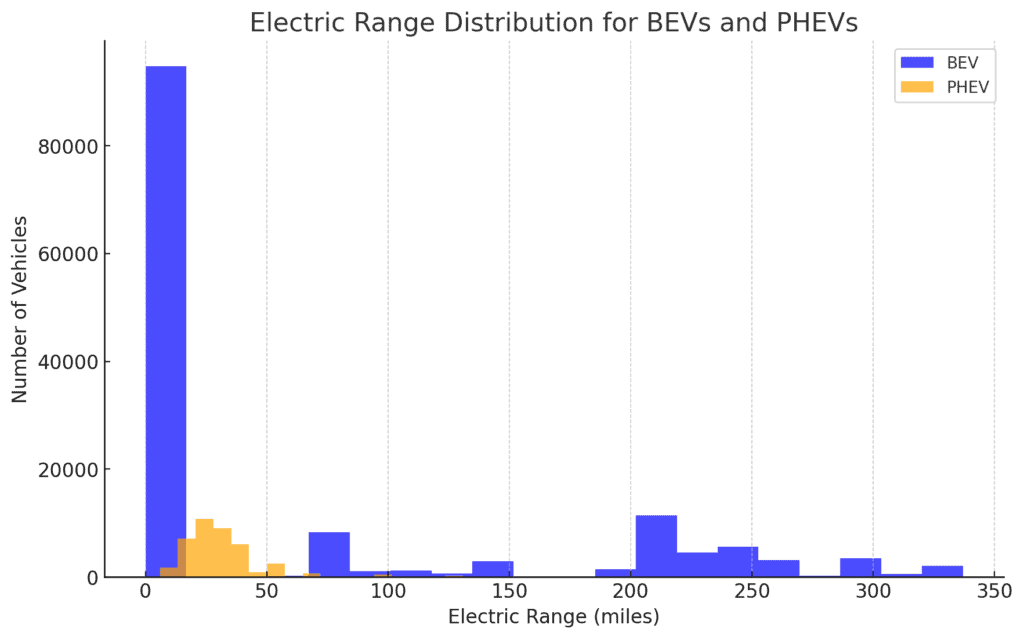
The histogram compares the electric range distribution between Battery Electric Vehicles (BEVs) and Plug-in Hybrid Electric Vehicles (PHEVs).
- BEVs typically have a wider and higher range, with many models achieving ranges well over 200 miles.
- PHEVs, on the other hand, generally have lower electric-only ranges, often under 50 miles, as they also rely on a gasoline engine.
This difference reflects the distinct roles these two types of vehicles play in the market: BEVs are designed for longer all-electric journeys, while PHEVs provide the flexibility of a gasoline engine for extended range.
Clean Alternative Fuel Vehicle (CAFV) Eligibility
The eligibility for clean alternative fuel benefits can impact market trends and consumer preferences.
We will assess the Clean Alternative Fuel Vehicle (CAFV) Eligibility to see how many vehicles qualify for these incentives and how this eligibility varies across BEVs and PHEVs.
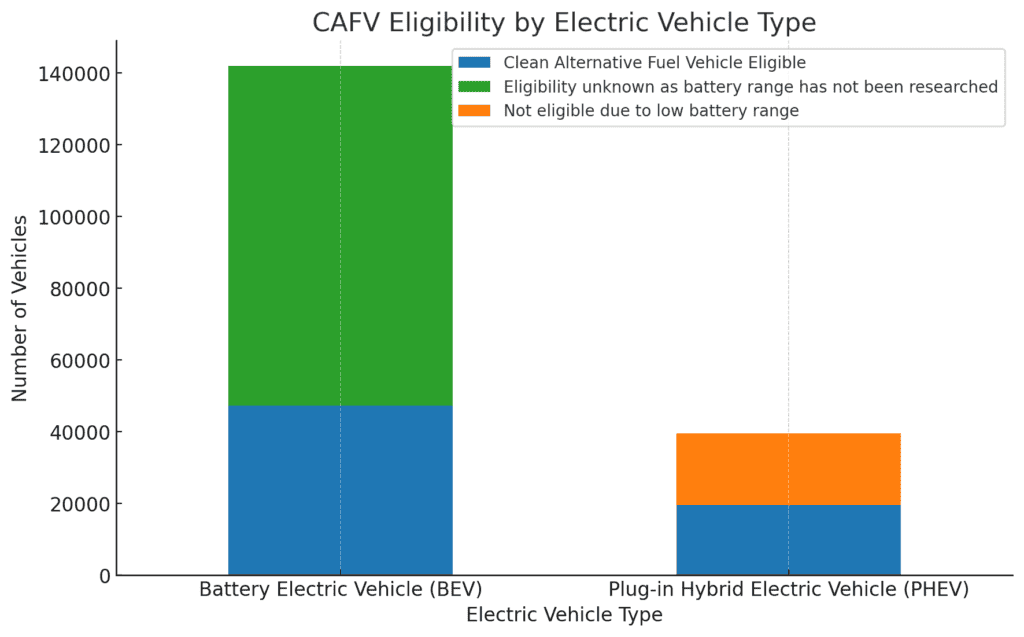
The stacked bar chart shows the percentage of vehicles that are eligible for Clean Alternative Fuel Vehicle (CAFV) incentives across BEVs and PHEVs:
- BEVs: A significant majority are eligible for CAFV incentives, reflecting their all-electric nature and alignment with clean energy goals.
- PHEVs: A smaller proportion is eligible for CAFV incentives, likely due to their lower electric-only range and partial reliance on gasoline.
Analysis of Electric Vehicle Makes and Models
Popularity trends among EV makes and models can inform market share and consumer preferences.
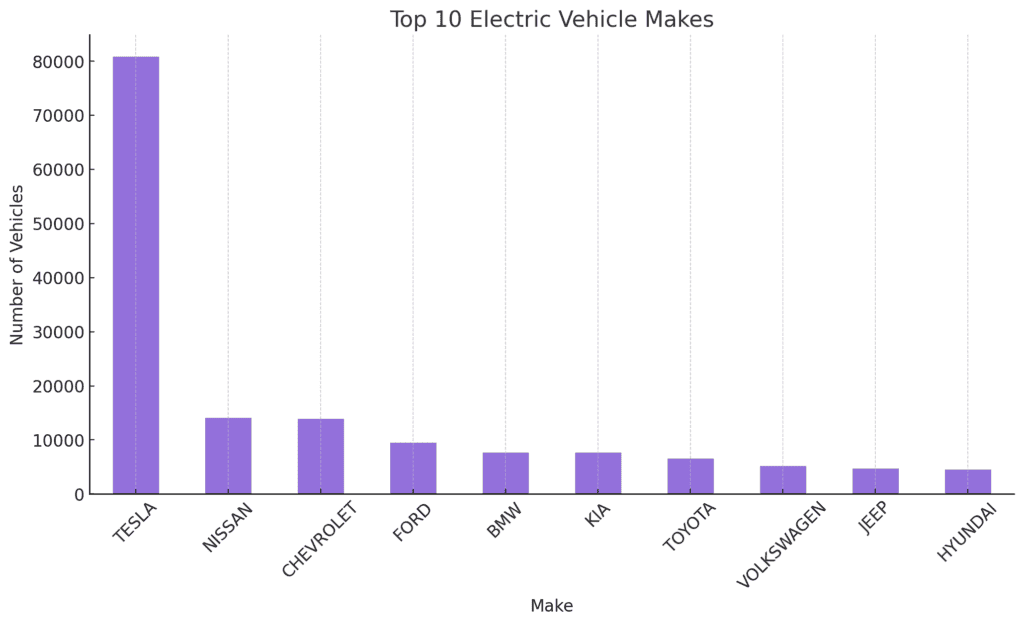
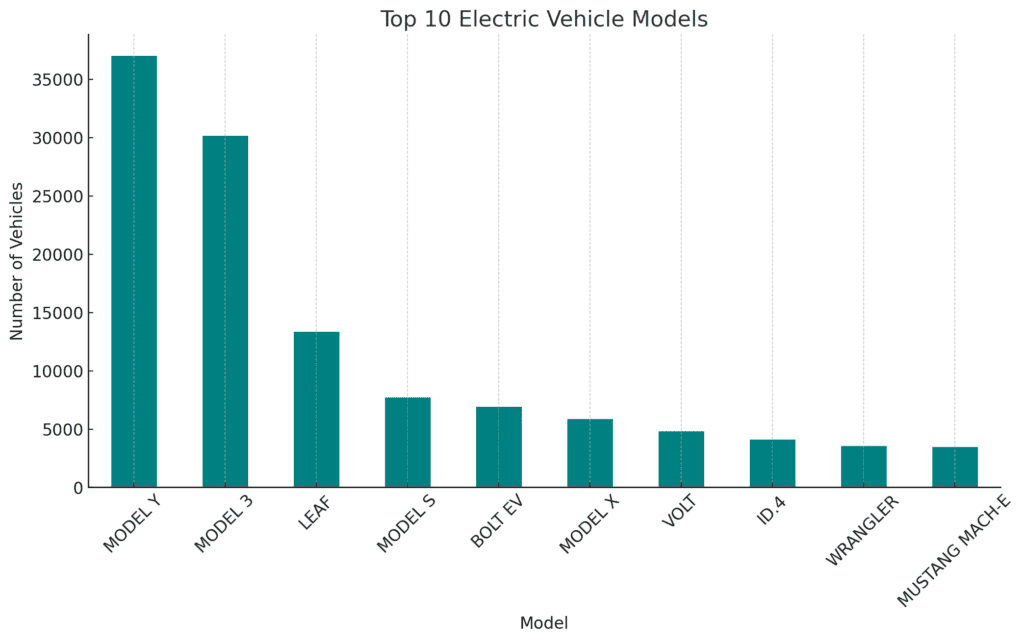
The bar charts highlight the top 10 most popular electric vehicle makes and models in Washington State:
- Top Makes: Tesla dominates the market, with multiple models contributing to its popularity. Other prominent brands include Nissan, Chevrolet, and Toyota.
- Top Models: Tesla models, particularly the Model 3 and Model S, are the most popular, followed by other models like the Nissan Leaf and Chevrolet Volt.
The top 5 Battery Electric Vehicle (BEV) models in Washington State are:
Serial No. | Car Model | Vehicles Sold |
1 | Tesla Model Y | 37,007 |
2 | Tesla Model 3 | 30,150 |
3 | Nissan Leaf | 13,356 |
4 | Tesla Model S | 7,731 |
5 | Chevrolet Bolt EV | 6,935 |
The top 5 Plug-in Hybrid Electric Vehicle (PHEV) models in Washington State are:
Serial No. | Car Model | Vehicles Sold |
1 | Chevrolet Volt | 4,798 |
2 | Jeep Wrangler | 3,543 |
3 | Chrysler Pacifica | 3,059 |
4 | Toyota Prius Prime | 2,810 |
5 | BMW X5 | 2,425 |
Legislative Districts and Electric Vehicle Adoption
This analysis will help us understand how EV adoption varies across different political and administrative regions which may help in infrastructure and policy planning.
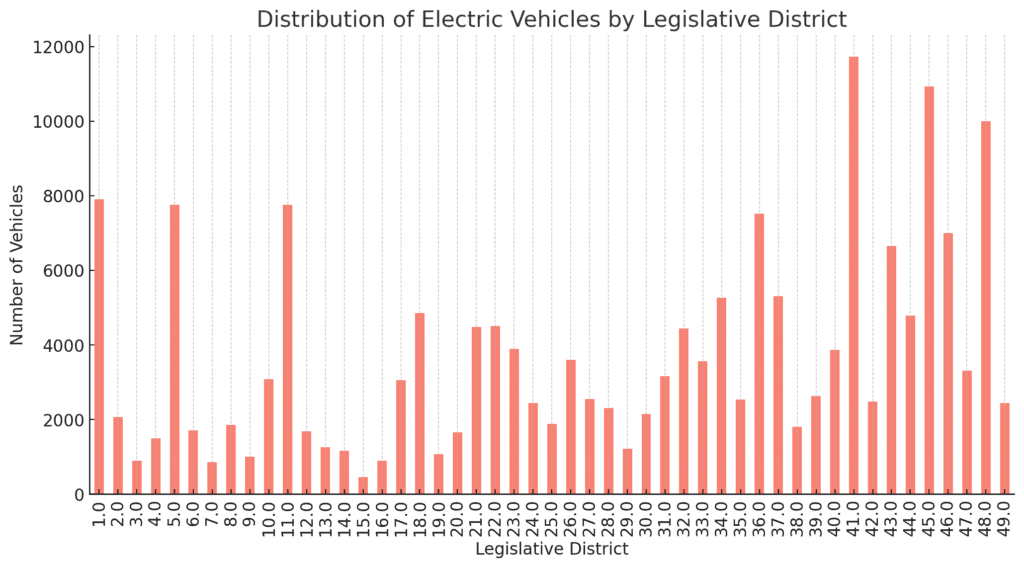
The bar chart displays the distribution of electric vehicles across different legislative districts in Washington State.
Some districts have notably higher concentrations of EVs (eg districts 1, 5, 11, 36, 41, 45 and 48) which could be due to factors like higher urbanisation, better charging infrastructure, or stronger local policies promoting EV adoption.
Electric Utilities and Their Role in Supporting EVs
Analysing the distribution by electric utility helps in understanding the regional infrastructure and potential load on the grid.
In other words, this will provide insights into the infrastructure supporting the growing number of EVs.
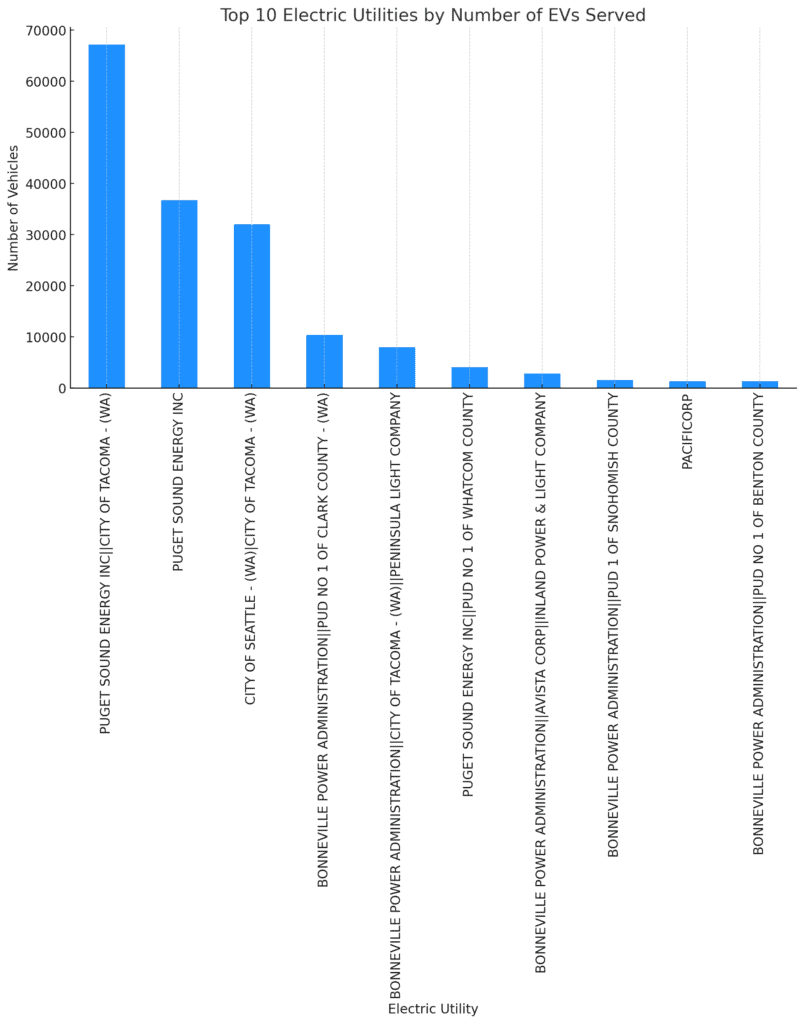
The bar chart shows the top 10 electric utilities by the number of electric vehicles they serve in Washington State.
Utilities like Puget Sound Energy and City of Seattle – Seattle City Light are among the largest providers for EVs, which is expected given their service areas include major urban centres with higher EV adoption rates.
Supplementary analysis
Market Share of Top Makes
We will calculate the market share of each of the top 10 makes relative to the total number of EVs in the dataset.
This will provide a clearer picture of how much of the market each brand controls.
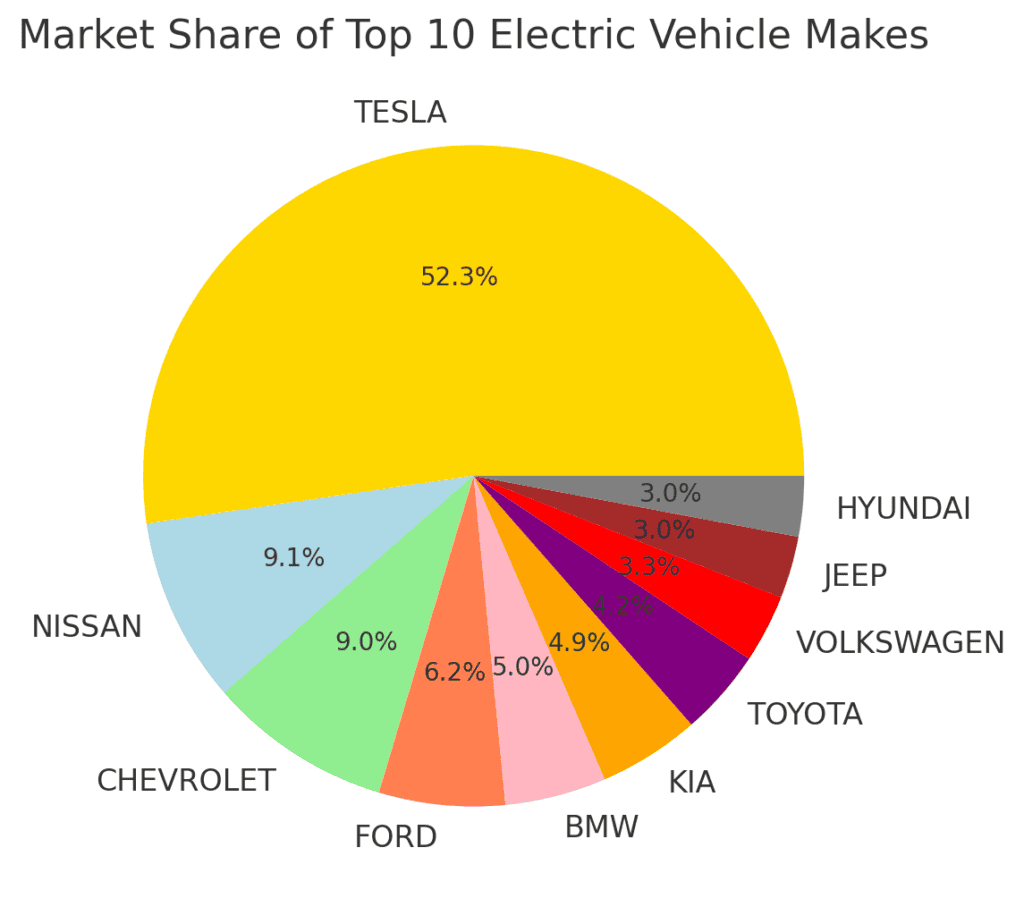
Tesla has a dominant share of the market, with nearly half of all registered EVs in the state.
Other manufacturers like Nissan, Chevrolet, and Ford have significantly smaller shares, indicating Tesla’s strong position in the EV market.
Trends in EV Adoption by Make Over Time
Let’s analyse how the adoption of EVs by these top makes has evolved over the years. This will give us insights into which brands are gaining or losing market share over time.
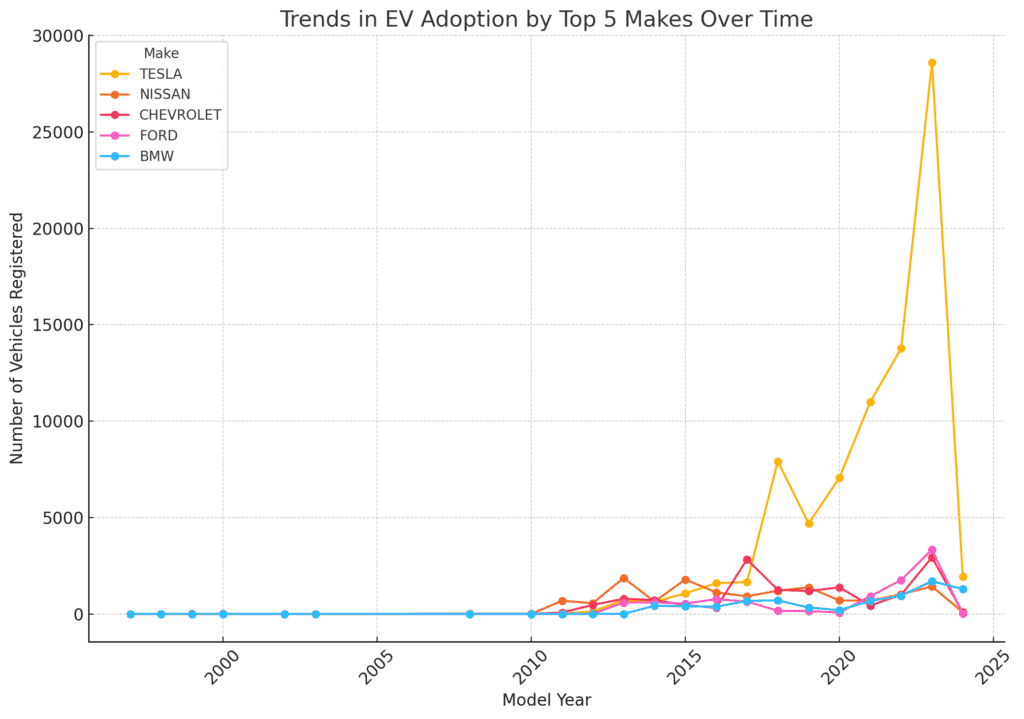
The line chart shows the trends in electric vehicle adoption over time for the top 5 makes: Tesla, Nissan, Chevrolet, Ford, and BMW.
This analysis highlights Tesla’s rapid and sustained growth in the EV market, while other brands are growing at a slower pace, with some seeing increased adoption in more recent years.
Market Share of Top Models
Let’s calculate the market share of these top 10 models relative to the total number of EVs in the dataset. This will give us a clearer picture of their dominance in the market.
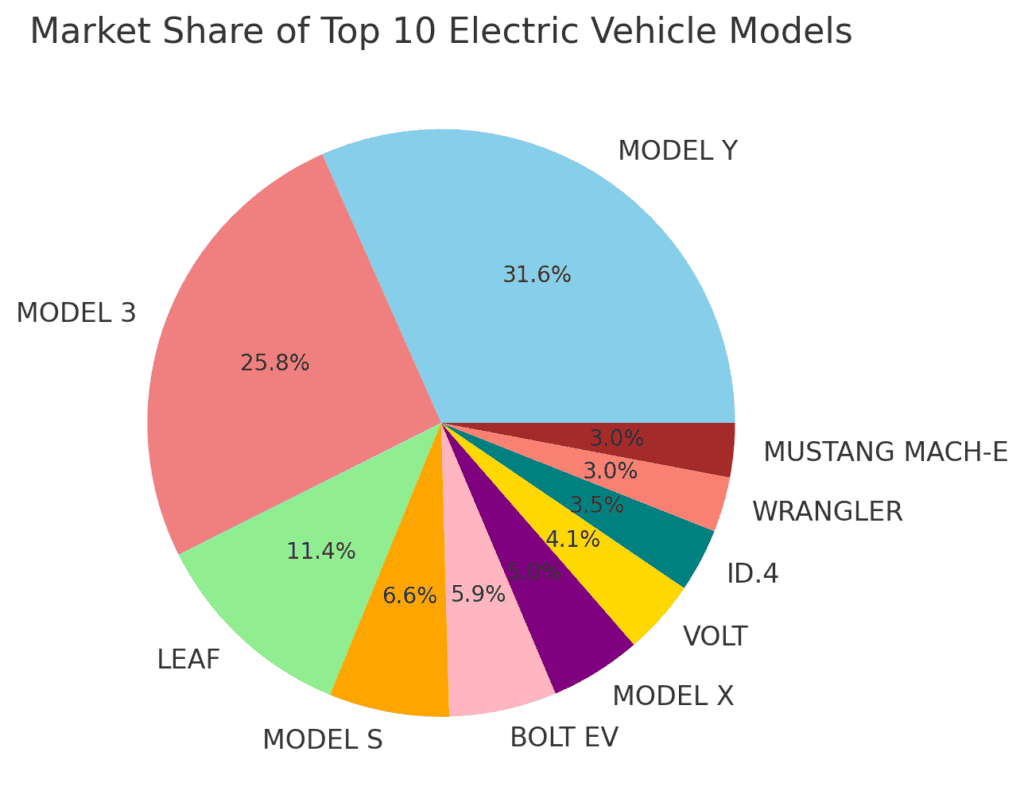
Tesla’s dominance is evident, with the Model Y and Model 3 together capturing over 37% of the market.
The Nissan Leaf is the most popular non-Tesla model, followed by the Chevrolet Bolt EV and Tesla’s other models (Model S and Model X).
Trends in EV Adoption by Model Over Time
Let’s analyse how the adoption of these top models has evolved over the years to understand which models are gaining or losing popularity.
This analysis highlights Tesla’s dominance in the EV market, with their models not only leading in current registrations but also showing strong upward trends over time.
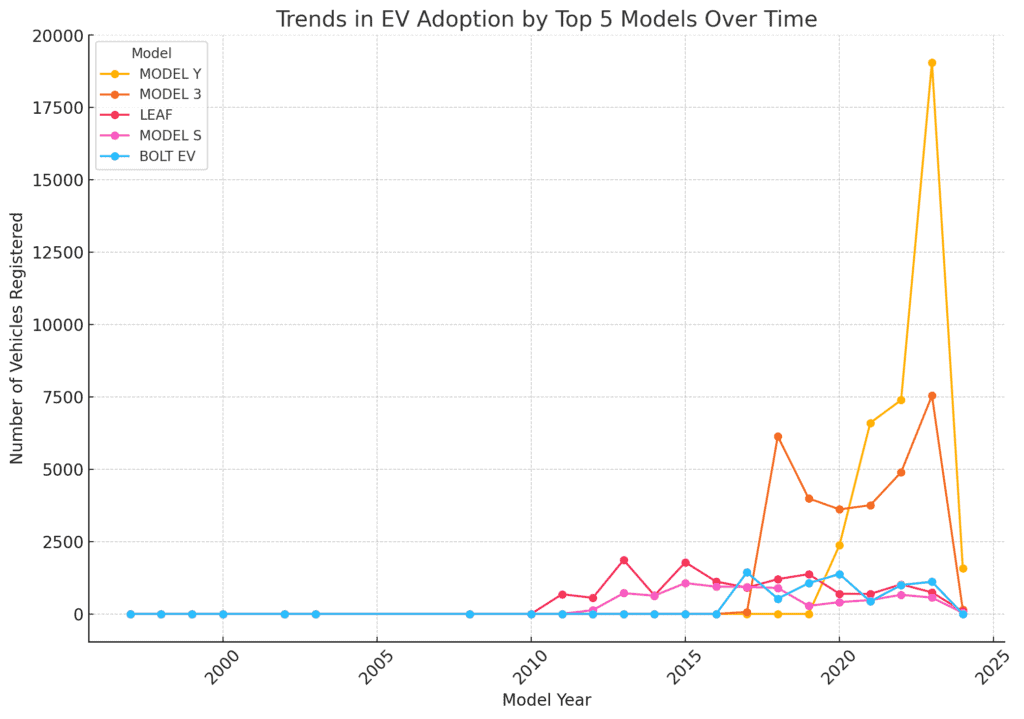
The Nissan Leaf, while still popular, has not seen the same level of growth in recent years, reflecting shifts in consumer preferences towards newer models like the Tesla Model Y and Model 3.
Comparison of BEV vs. PHEV Adoption Trends
Let’s try to understand how the adoption trends of Battery Electric Vehicles (BEVs) and Plug-in Hybrid Electric Vehicles (PHEVs) compare over time.
This analysis will highlight the differences in growth patterns between these two types of electric vehicles.
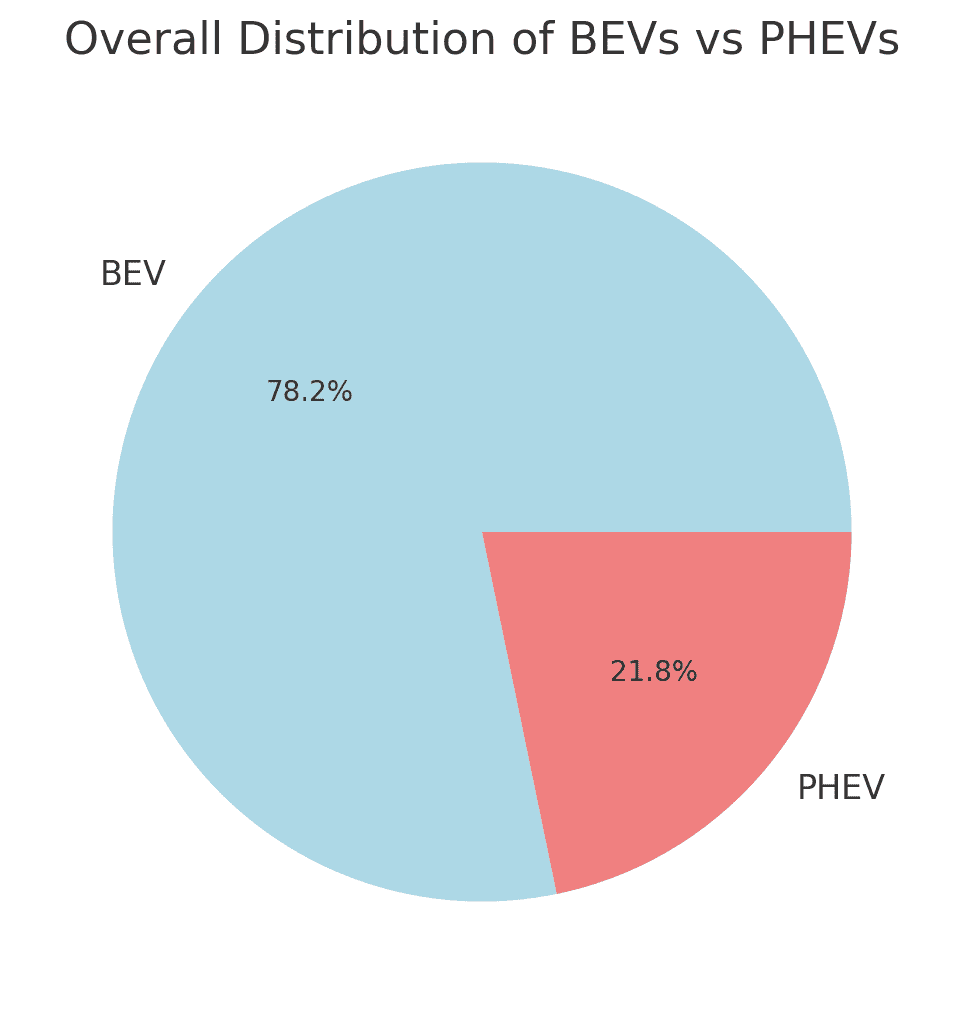
- Overall Distribution of BEVs and PHEVs
The pie chart and data show the overall distribution between BEVs and PHEVs in Washington State:
BEVs: 141,973 vehicles (78.2%)
PHEVs: 39,485 vehicles (21.8%)
BEVs make up the majority of the electric vehicles, with nearly four times as many BEVs as PHEVs. This reflects a stronger preference for fully electric vehicles compared to hybrids that still rely on gasoline.
- Adoption Trends Over Time
The line chart shows the adoption trends of Battery Electric Vehicles (BEVs) and Plug-in Hybrid Electric Vehicles (PHEVs) over time:
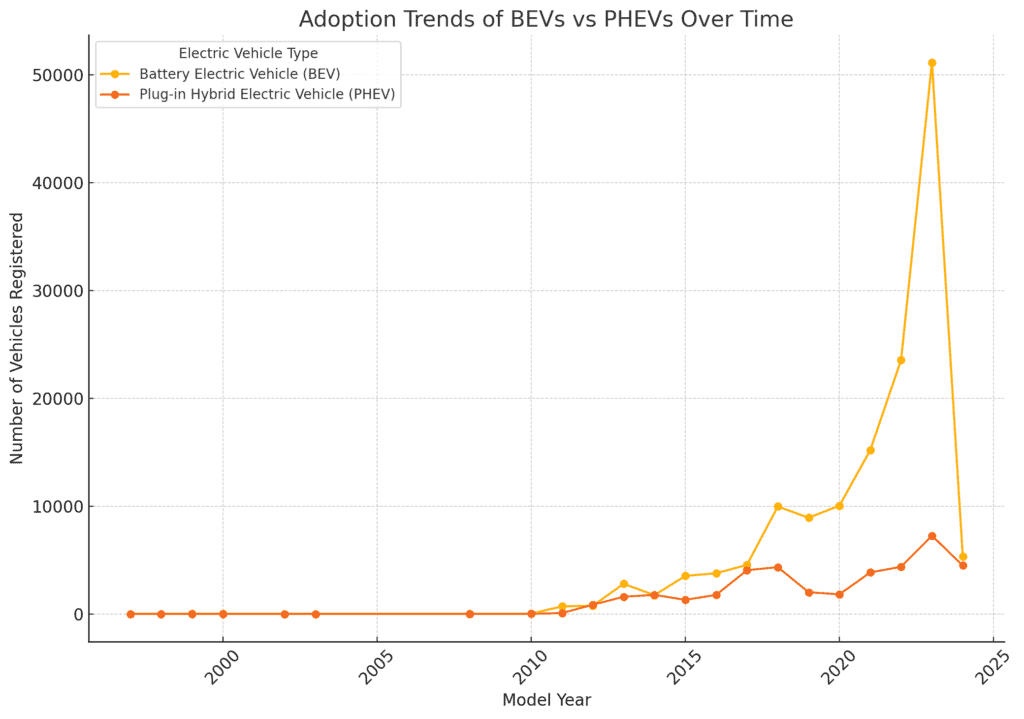
BEVs: There is a clear upward trend in BEV registrations, with a significant increase in the most recent years. This indicates growing consumer preference for fully electric vehicles.
PHEVs: While PHEV registrations have also increased over time, the growth is more modest compared to BEVs. PHEVs saw a more gradual rise and have not experienced the same rapid growth as BEVs in recent years.
This comparison highlights the stronger market momentum behind BEVs, likely driven by advancements in battery technology, increased range, and a growing infrastructure for charging fully electric vehicles.
What factors could influence EV adoption rates?
Electric Vehicle (EV) adoption rates are likely to be influenced by a variety of factors that can be broadly categorised into economic, technological, environmental, policy-driven, and consumer-related factors.
Here’s an overview of these key influences:
Economic Factors
- Purchase Price: The upfront cost of an EV is a significant factor. Although prices have been decreasing, EVs are often more expensive than their internal combustion engine (ICE) counterparts. Government incentives, tax rebates, and subsidies can reduce the effective purchase price and encourage adoption.
- Total Cost of Ownership (TCO): This includes the long-term costs of owning a vehicle, such as fuel (electricity vs. gasoline), maintenance, and insurance. EVs typically have lower maintenance and fuel costs, which can make them more attractive over time.
- Resale Value: The expected resale value of an EV also impacts adoption. As the EV market matures and battery technology improves, resale values are expected to stabilize and potentially increase.
Technological Factors
- Battery Technology and Range: The driving range of EVs on a single charge is a critical factor. Advances in battery technology that increase range and reduce charging times make EVs more practical for everyday use and long trips.
- Charging Infrastructure: The availability and accessibility of charging stations influence EV adoption. Dense and well-distributed charging networks reduce range anxiety and make EVs more convenient.
- Vehicle Variety and Performance: The availability of diverse EV models, including different body styles, performance levels, and price points, broadens the appeal to various consumer segments.
Environmental and Social Factors
- Environmental Awareness: Growing awareness of climate change and the environmental benefits of EVs, such as lower emissions, drives consumer interest and adoption.
- Social Influence and Brand Image: The perception of EVs as innovative and eco-friendly, along with strong brand loyalty (e.g., Tesla), can significantly influence consumer decisions.
Policy and Regulatory Factors
- Government Incentives: Tax credits, rebates, and incentives (both federal and state) play a significant role in making EVs more affordable and attractive to consumers.
- Regulations and Emissions Standards: Stricter emissions regulations and the push for zero-emission vehicles by governments can accelerate EV adoption. Some regions also implement bans on the sale of new ICE vehicles by certain dates, further pushing consumers toward EVs.
- Subsidies for Charging Infrastructure: Government support for the development of charging infrastructure, such as subsidies for installing home chargers or funding public charging stations, is crucial for widespread EV adoption.
Market and Consumer Factors
- Consumer Awareness and Education: Knowledge about EV benefits, available models, and charging options is crucial. Lack of awareness can be a barrier to adoption.
- Perceived Barriers: Concerns about battery life, charging times, and the availability of charging infrastructure can deter potential buyers.
- Urbanisation and Commuting Patterns: Urban areas with shorter average commutes and more charging options tend to have higher EV adoption rates. Rural areas may see slower adoption due to fewer charging stations and longer travel distances.
Energy and Utility Factors
- Electricity Costs: The cost of electricity relative to gasoline influences the economic appeal of EVs. Regions with cheaper electricity see higher adoption rates.
- Renewable Energy Integration: The integration of renewable energy sources into the grid can enhance the environmental appeal of EVs, particularly if consumers can charge their vehicles using solar or wind power.
Cultural and Behavioral Factors
- Cultural Norms: In regions where sustainability and green technology are highly valued, EV adoption is likely to be higher.
- Lifestyle Fit: EVs may be more appealing to consumers who value technology, innovation, and environmental responsibility. Also, early adopters and tech enthusiasts often drive the initial growth of the EV market.
Conclusion
As our analysis reveals, electric vehicle adoption in Washington State is on a rapid upward trajectory, driven largely by the increasing popularity of Battery Electric Vehicles (BEVs) and the dominance of leading manufacturers like Tesla.
Factors such as the availability of diverse models, advancements in battery technology, and supportive policies are playing crucial roles in accelerating this shift.
While BEVs are leading the charge with their extended range and full-electric capabilities, Plug-in Hybrid Electric Vehicles (PHEVs) continue to appeal to consumers seeking a balance between electric driving and traditional fuel options.
The data also underscores the growing consumer confidence in EV technology and highlights the importance of continued investment in charging infrastructure and supportive policies to sustain this momentum.
As we look to the future, it’s clear that electric vehicles are not just a trend but a pivotal element in the journey towards a more sustainable and connected world of transportation.