
Predicting bank deposit subscriptions using machine learning
Introduction
The ability to predict customer behaviour has become increasingly important for businesses, especially in the financial sector.
For banks, understanding which clients are likely to subscribe to a term deposit can lead to more effective marketing strategies and better resource allocation.
This analysis explores a beginner’s approach to predicting whether a client will subscribe to a term deposit using machine learning techniques.
In this exploration, we utilise a publicly available dataset from a bank’s marketing campaign. We aim to uncover key insights and build a basic predictive model.
Description of the bank deposit dataset
The dataset was created as part of a research project aimed at developing predictive models for direct marketing campaigns conducted by a Portuguese banking institution.
The campaigns were focused on promoting term deposits to potential clients through phone calls.
Dataset Characteristics
Total Instances (Records): 45,211
Total Attributes (Features): 17
- Input Features: 16
- Output Feature (Target Variable): 1
The dataset for this analysis can be downloaded from this GitHub link and here. The Python code for the analysis can be downloaded here.
Notable Observations
Imbalance
The dataset seems imbalanced, with a higher number of ‘no’ responses compared to ‘yes’.
This is an important consideration when building predictive models, as it may affect the performance and evaluation metrics.
Several techniques (eg. SMOTE) can be used to address this problem but may be outside the scope of our main objective for now.
Data Quality
Some features contain ‘unknown’ categories, which may require preprocessing steps such as imputation or exclusion. Using these methods would normally depend on the analysis approach.
Predictive Challenge
The dataset poses a realistic and challenging problem for classification algorithms, making it suitable for practicing and bench-marking various machine learning techniques.
Summary statistics
Categorical Variables
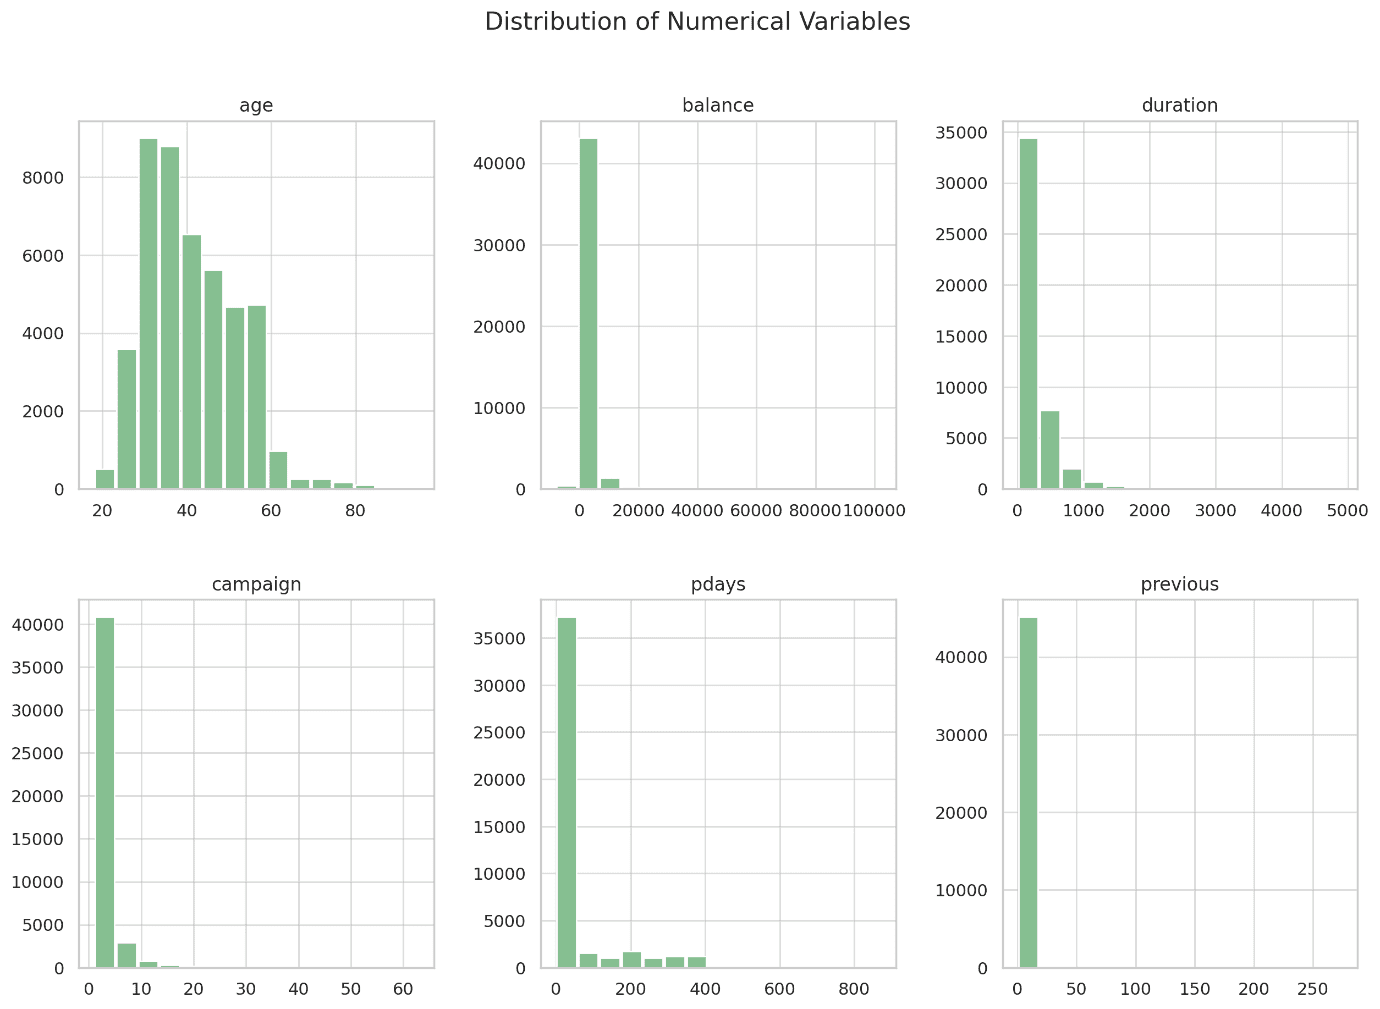
The summary statistics for the numerical variables provide a snapshot of the central tendencies and variability in the data:
Measure | Age | Balance | Day | Duration | Campaign | Pdays | Previous |
Mean | 41 | 1362.27 | 16 | 258 | 3 | 40 | 1 |
Std | 11 | 3044.77 | 8 | 258 | 3 | 100 | 2 |
Min | 18 | -8019.00 | 1 | 0 | 1 | -1 | 0 |
Max | 95 | 102127.00 | 31 | 4918 | 63 | 871 | 275 |
- Age: The average age is around 41 years, with a minimum of 18 and a maximum of 95.
- Balance: The average account balance is 1362 units, but the large standard deviation indicates significant variability. There’s also a notable negative balance, with the minimum value being -8019.
- Day: The “day” column represents the last contact day of the month, with values ranging from 1 to 31.
- Duration: Contact duration varies widely, with an average of 258 seconds and a maximum of nearly 5000 seconds.
- Campaign: The number of contacts performed ranges from 1 to 63, with an average of about 2.76.
- Pdays: This variable has a large range (from -1 to 871), indicating the days since the client was last contacted. The value of -1 appears to be significant and likely indicates that the client had not been previously contacted.
- Previous: The number of contacts before this campaign, ranging from 0 to 275.
Categorical Variables
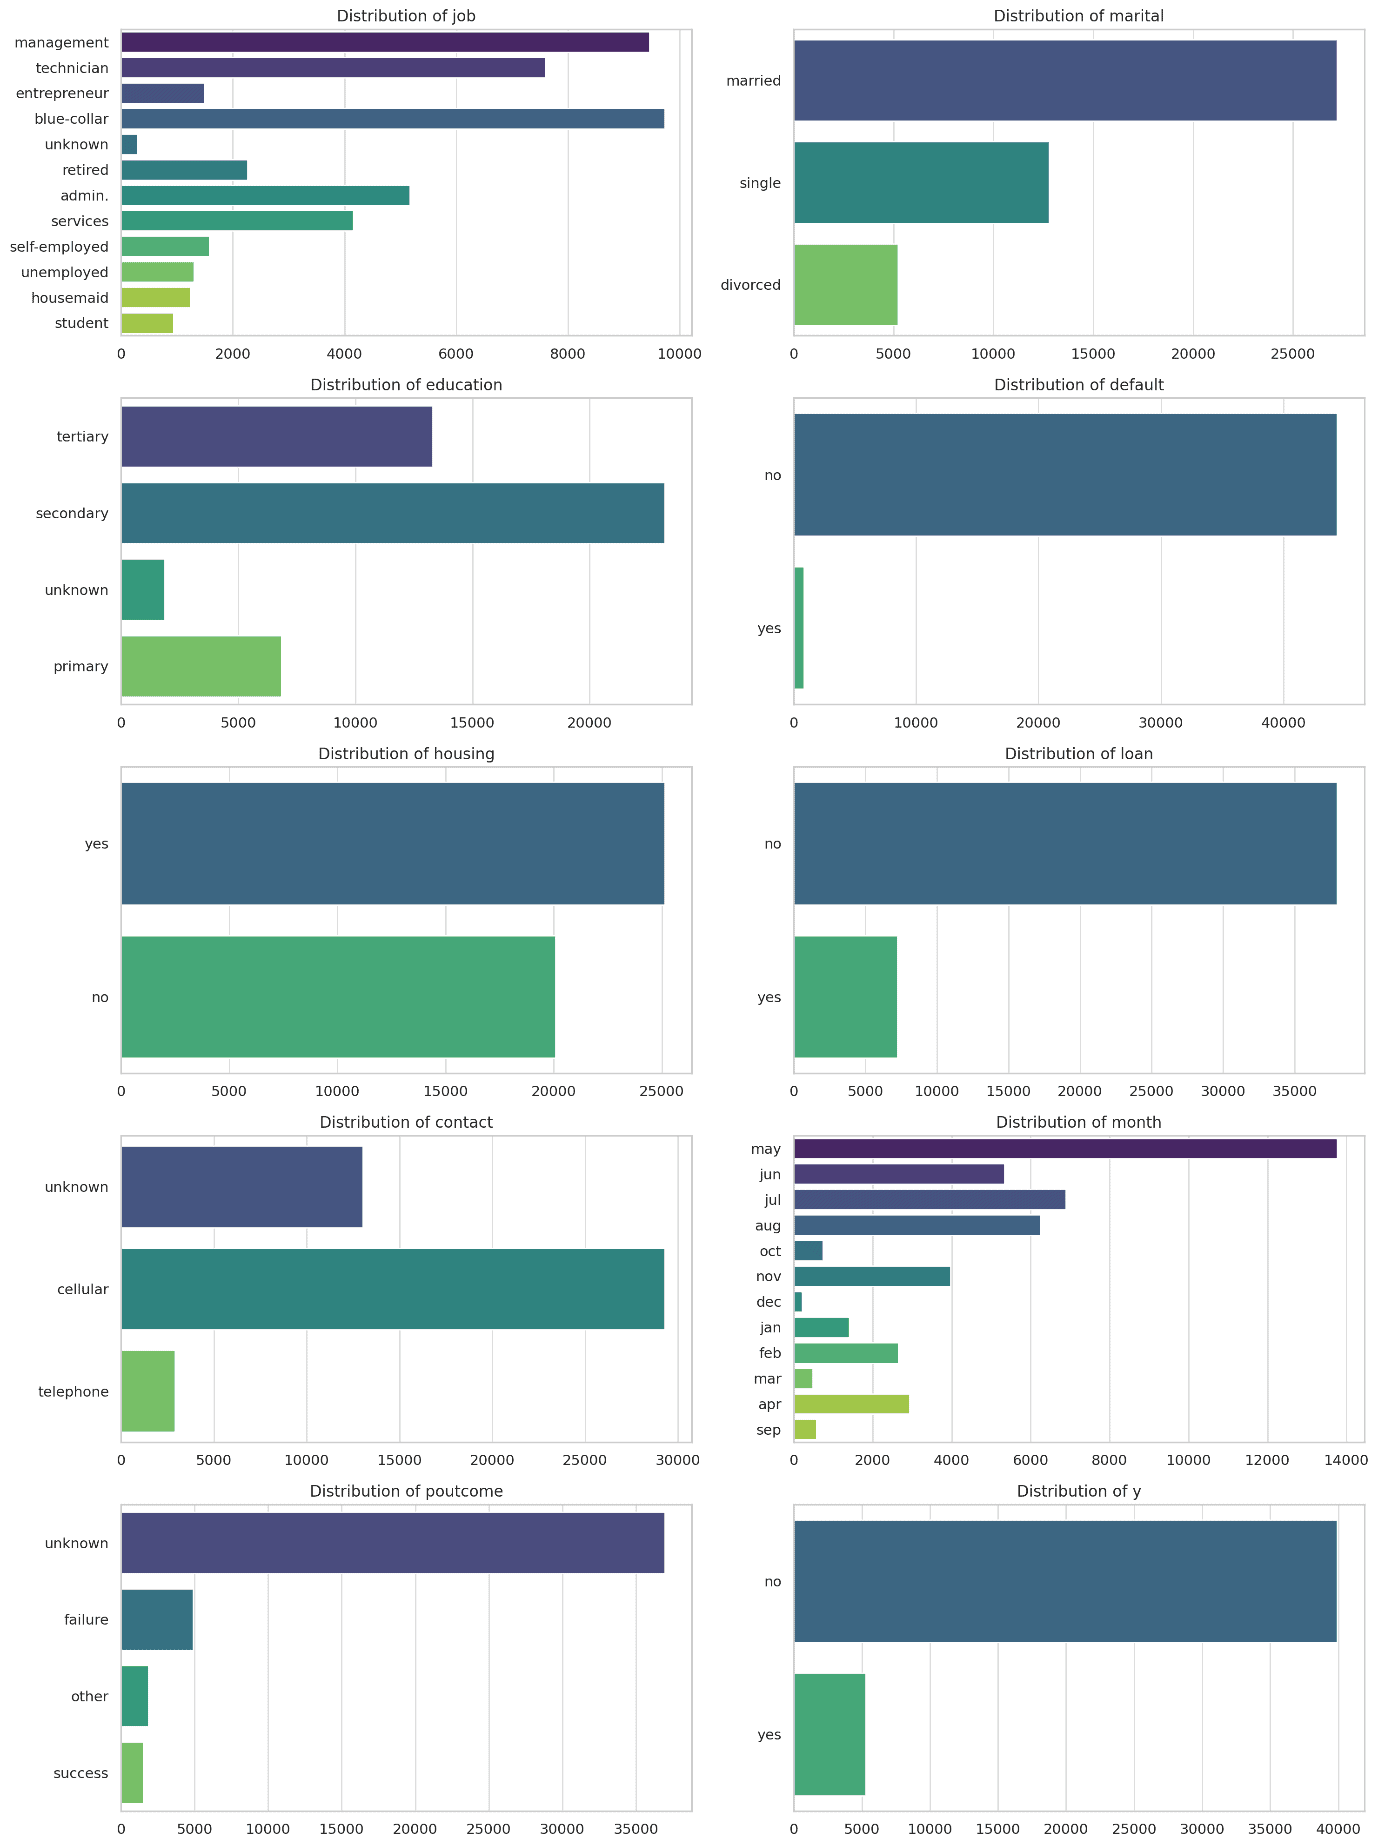
- Job: The most common job types are blue-collar, management, and technician.
- Marital Status: Most clients are married, followed by single and divorced.
- Education: Secondary education is most common, followed by tertiary.
- Default: Almost all clients do not have a credit default.
- Housing: A large number of clients have housing loans.
- Loan: Most clients do not have a personal loan.
- Contact: The majority of contacts are made using unknown methods, followed by telephone.
- Month: May is the most common month for contacts, followed by August, July, and June.
- Poutcome: Most clients had no previous outcome recorded (unknown).
- Subscription (y): The target variable shows that a minority of clients (around 11%) subscribed to a term deposit.
Predictive Analytics
In this analysis, a systematic approach is followed to build and evaluate a predictive model for determining whether a client will subscribe to a term deposit.
The steps are outlined below:
Data Preprocessing
- Encoding Categorical Variables: Categorical variables are converted into numeric format using Label Encoding, making the data suitable for machine learning algorithms.
- Feature Scaling: We standardised the numerical features to ensure that all features contribute equally to the model’s predictions.
Dataset Splitting
- Training and Testing Split: The dataset was split into a training set (70%) and a testing set (30%) to train the model and evaluate its performance on unseen data.
Model Selection
- Random Forest Classifier: We chose a Random Forest classifier due to its robustness and ability to handle complex datasets with multiple features.
Model Training
- The model was trained using the training data to learn the relationships between the features and the target variable.
Model Evaluation
- Predictions: The model made predictions on the test set.
- Confusion Matrix: A confusion matrix was generated to evaluate the accuracy and error types (True Positives, False Positives, True Negatives, False Negatives).
- Classification Report: Precision, recall, and F1-score were calculated to assess the model’s performance.
- ROC Curve: The Receiver Operating Characteristic (ROC) curve and Area Under the Curve (AUC) were plotted to evaluate the model’s ability to distinguish between the two classes (yes/no).
Predictive Analytics Results
The Random Forest Classifier was used to predict whether a client will subscribe to a term deposit based on the available features.
Here are the results:
Confusion Matrix
This matrix indicates that the model is quite effective at predicting clients who will not subscribe, but less so for those who will.
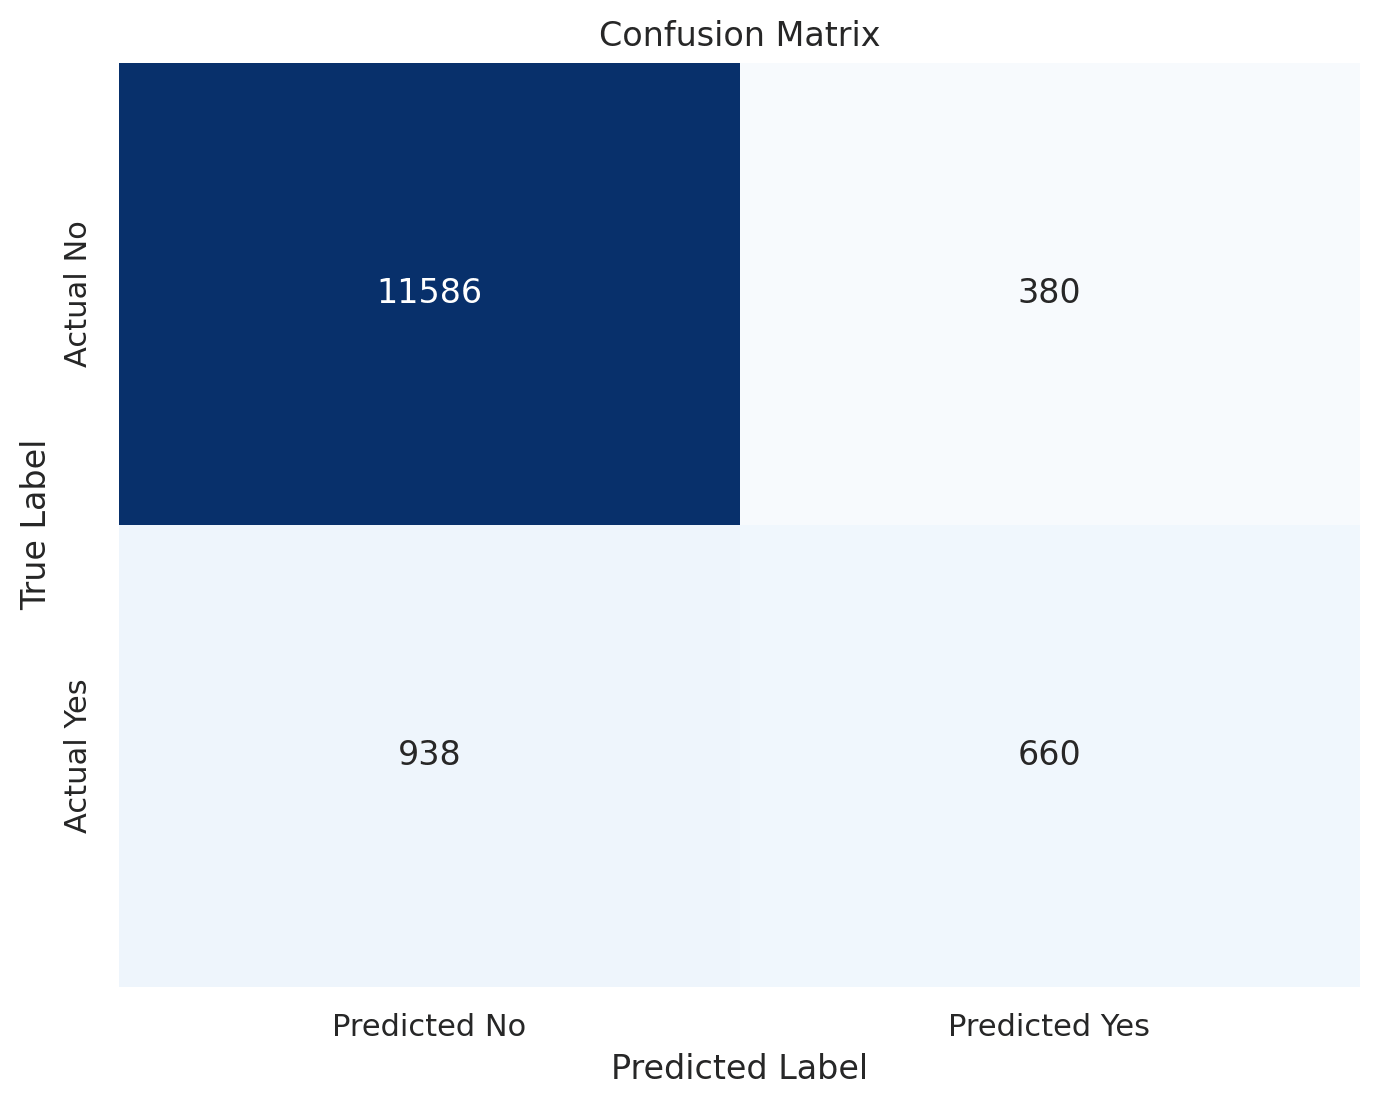
True Negatives (TN): 11,586
These are the instances where the model correctly predicted that the client would not subscribe to a term deposit. This is a correct rejection.
False Positives (FP): 380
These are the instances where the model predicted that the client would subscribe to a term deposit, but the client actually did not.
This is a type of error called a “false alarm.”
False Negatives (FN): 938
These are the instances where the model predicted that the client would not subscribe to a term deposit, but the client actually did.
This is a type of error called a “miss.”
True Positives (TP): 660
These are the instances where the model correctly predicted that the client would subscribe to a term deposit.
This is a correct identification.
Classification Report
Overall accuracy is 90%, with the model performing much better at identifying clients who will not subscribe (No) compared to those who will (Yes).
| Precision | Recall | f1-score | Support |
No | 0.93 | 0.97 | 0.95 | 11966.00 |
Yes | 0.63 | 0.41 | 0.50 | 1598.00 |
Accuracy | 0.90 | 0.90 | 0.90 | 0.90 |
Macro Avg | 0.78 | 0.69 | 0.72 | 13564.00 |
Weighted Avg | 0.89 | 0.90 | 0.89 | 13564.00 |
Precision indicates how many of the predicted “Yes” labels were actually correct. Here, about 63% of the clients predicted to subscribe actually did so.
Recall shows how many of the actual “Yes” cases were correctly identified by the model. The model correctly identified about 41% of the clients who subscribed.
The F1-score for the positive class (“Yes”) is 0.50, indicating a moderate balance between precision and recall.
ROC-AUC Score
The ROC-AUC score of 0.924 indicates that the model has a good ability to distinguish between the two classes (Yes and No).
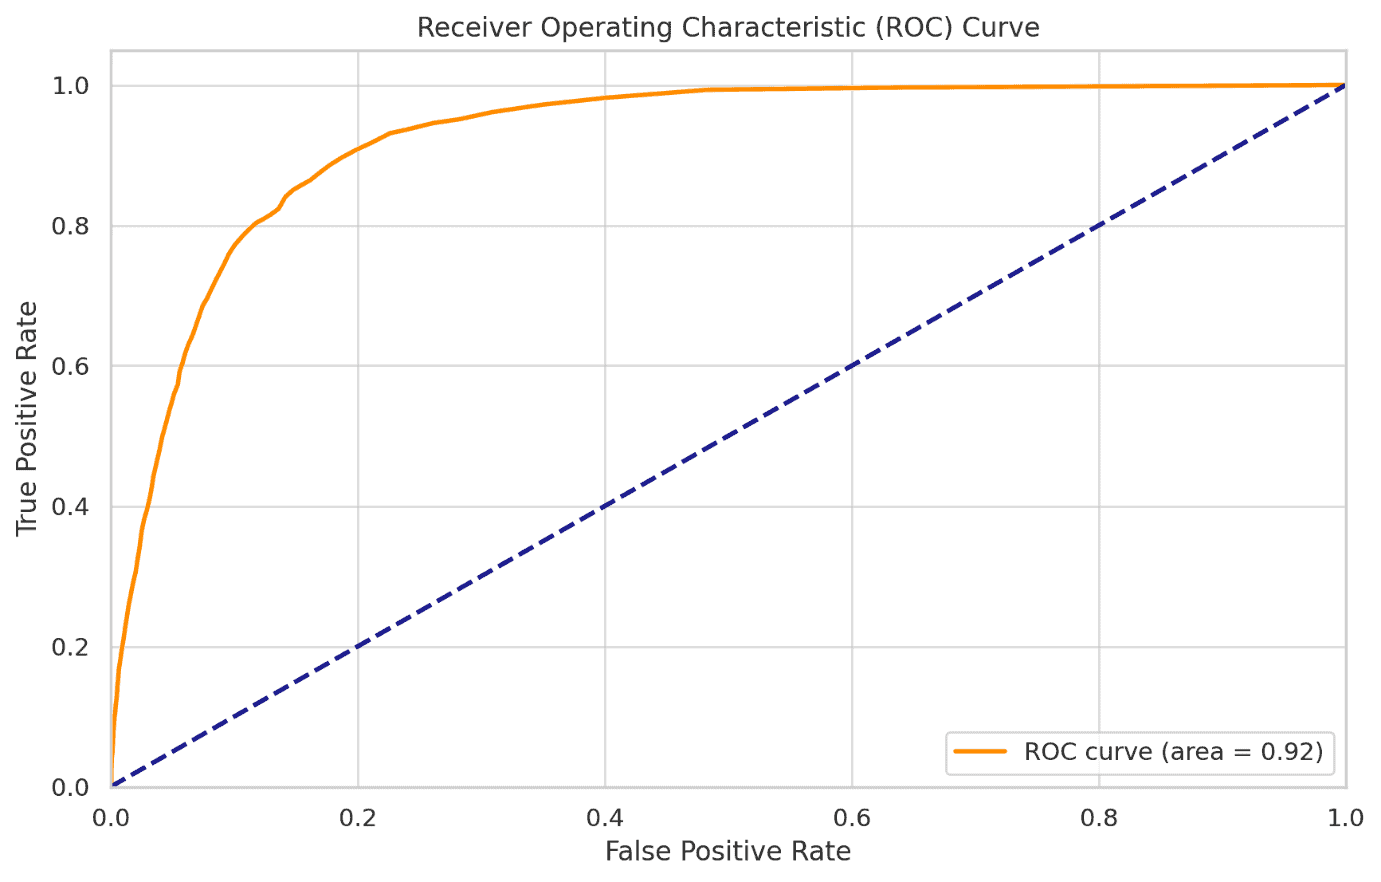
The ROC curve indicates a good balance between sensitivity (True Positive Rate) and specificity (False Positive Rate).
The area under the curve (AUC) of 0.924 further confirms that the model is effective in distinguishing between clients who will and will not subscribe to a term deposit.
Summary
Key findings from the analysis include:
- The model achieved an overall accuracy of 90%, with a strong ability to correctly identify clients who would not subscribe.
- The model’s ROC-AUC score of 0.924 indicates a high level of discrimination between those who will and will not subscribe.
- However, the model had a lower recall for predicting positive cases (clients who subscribe), with a recall of 41% and a precision of 63%, indicating room for improvement in identifying potential subscribers.
Recommendations
Improve Model Sensitivity
- SMOTE (Synthetic Minority Over-sampling Technique) may have to be considered to balance the dataset or cost-sensitive learning to reduce the impact of false negatives. This can help in better identifying potential subscribers.
- Experiment with other algorithms like Gradient Boosting Machines (GBM), XGBoost, or Neural Networks, which may offer better performance for this classification task.
Feature Engineering
New features or interactions may have to be created between features that might improve model performance.
For example, consider the client’s behavior over time or the combination of balance with other financial indicators.
Conclusion
The prediction achieved a solid accuracy of 90%, indicating that it is effective in identifying clients who are unlikely to subscribe.
However, the model’s precision and recall for clients who do subscribe suggest that there is room for improvement, particularly in reducing the number of false negatives.
By refining the model and exploring alternative algorithms or additional features, banks can further enhance their predictive capabilities, leading to more targeted and efficient marketing campaigns.
Ultimately, this data-driven approach can help financial institutions not only improve their conversion rates but also foster stronger customer relationships through personalised marketing efforts.
REFERENCES
Moro,S., Rita,P., and Cortez,P.. (2012). Bank Marketing. UCI Machine Learning Repository. https://doi.org/10.24432/C5K306.


2 responses
How can I get the dataset?
Thanks
Check the introduction section