SQL exercises on retail shopping: Multiple table queries
We have explored Structured Query Language (SQL) problems in real-world business scenarios using single table queries in a previous post which can be accessed here.
We will now focus on scenarios by using multiple table queries albeit still within a typical retail business. If you’re new to SQL and haven’t learned how to install SQL Server 2022 Developer Edition yet, this link will guide you through the process.
You can download the “.bak” database file for the HR and Product Orders database here. Follow this procedure to restore the “.bak” database file on the installed SQL Server Management Studio.
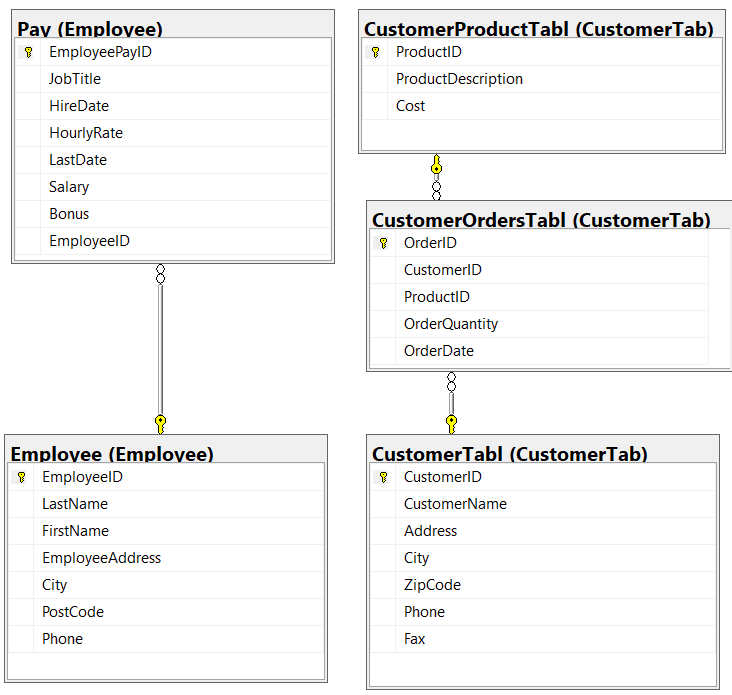
A relationship diagram for the HR and Product Orders tables is provided on the right if you are using a laptop or desktop computer. Please review this diagram to familiarise yourself with the table relationships before tackling the scenario questions.
Sample solutions to the business scenario problems are provided after each question. It is recommended to first attempt solving the problems independently before reviewing the provided solutions. Each sample solution includes an explanation of how the problem is solved.
INNER JOIN
1. Employee Salary and Job Information
In a company, you need to generate a report that combines employee personal information and their job-related details. You have two tables, Employee.Employee and Employee.pay. Create a report that combines employee personal information (name, address, and contact) with their job-related details (job title, hire date, salary, and bonus).
Sample solution
SELECT E.LastName,
E.FirstName,
E.EmployeeAddress,
E.City,
E.PostCode,
E.Phone,
EP.JobTitle,
EP.HireDate,
EP.Salary,
EP.Bonus
FROM Employee.Employee E
INNER JOIN Employee.Pay EP ON E.EmployeeID = EP.EmployeeID
Explanation
This SQL query retrieves detailed information about employees by combining data from two tables: Employee.Employee (aliased as E) and Employee.Pay (aliased as EP). It uses an INNER JOIN to match rows from both tables based on the EmployeeID column, which must be present in both tables for the join to succeed.
Selected Columns: The query selects personal details such as LastName, FirstName, EmployeeAddress, City, PostCode, and Phone from the Employee table. It also retrieves employment details like JobTitle, HireDate, Salary, and Bonus from the Pay table.
INNER JOIN: The INNER JOIN clause ensures that only records with matching EmployeeID values in both tables are included in the results. If an EmployeeID does not have a corresponding entry in both tables, it will be excluded from the result set.
2. Employee Performance Evaluation
In a company, you want to evaluate employee performance by combining their personal information and job-related details. You have two tables, Employee.Employee and Employee.pay. Create a report that combines employee personal information (name, address, and contact) with their job-related details (job title, hire date, salary, and bonus) for performance evaluation. Additionally, calculate the total compensation (Salary + Bonus) for each employee.
Sample solution
SELECT E.LastName,
E.FirstName,
E.EmployeeAddress,
E.City,
E.PostCode,
E.Phone,
EP.JobTitle,
EP.HireDate,
EP.Salary,
EP.Bonus,
(EP.Salary + EP.Bonus) AS TotalCompensation
FROM Employee.Employee E
INNER JOIN Employee.Pay EP ON E.EmployeeID = EP.EmployeeID
Explanation
Selected Columns: The query selects personal details such as LastName, FirstName, EmployeeAddress, City, PostCode, and Phone from the Employee table. It also retrieves job-related information like JobTitle, HireDate, Salary, and Bonus from the Pay table.
Calculating Total Compensation: The query calculates the total compensation for each employee by adding their Salary and Bonus values. This sum is labeled as TotalCompensation and provides a complete view of an employee’s earnings.
INNER JOIN: The INNER JOIN clause ensures that the query returns only records where the EmployeeID exists in both the Employee and Pay tables. This join is used to combine employee personal information with their payment details.
3. Analysis of Employee Promotion Eligibility
In a company, you want to identify employees eligible for promotion based on their job titles and the duration of their employment. You have two tables: Employee.Employee and Employee.pay. Create a report that identifies employees eligible for promotion based on the following criteria:
- Employees with the job title “Sales Support” or “Salesman.”
- Employees who have been with the company for at least 5 years.
Sample solution
SELECT E.LastName,
E.FirstName,
EP.JobTitle,
EP.Salary
FROM Employee.Employee E
INNER JOIN Employee.Pay EP ON E.EmployeeID = EP.EmployeeID
WHERE (EP.JobTitle = 'Sales Support' OR EP.JobTitle = 'Salesman')
AND DATEDIFF (YEAR, EP.HireDate, EP.LastDate) >= 5;
Explanation
Selected Columns: The query selects LastName and FirstName from the Employee table, and JobTitle and Salary from the Pay table. These columns provide personal and job-related information about each employee.
INNER JOIN: The INNER JOIN clause matches rows from the Employee table with rows from the Pay table based on the EmployeeID, ensuring that only records with matching EmployeeID values are included in the results.
Filtering with WHERE Clause: The query applies two filters:
(EP.JobTitle = 'Sales Support' OR EP.JobTitle = 'Salesman'): This condition filters the results to include only employees whose job title is either ‘Sales Support’ or ‘Salesman’.DATEDIFF(YEAR, EP.HireDate, EP.LastDate) >= 5: This condition ensures that only employees with at least 5 years of service (calculated by the difference in years between theHireDateandLastDate) are included.
4. Employee Bonus Eligibility
In a company, you want to identify employees eligible for a year-end bonus based on their job titles and bonus amounts. You have two tables: Employee.Employee and Employee.pay. Create a report that lists employee details and sort the results by job title and bonus amount. You want to identify employees who are eligible for a bonus based on the following criteria:
- Employees with the job title “Salesman” or “Sales Support”
- Employees who have received a bonus greater than or equal to $1000.
Sample solution
SELECT E.LastName,
E.FirstName,
E.City,
EP.JobTitle,
EP.Bonus
FROM Employee.Employee E
INNER JOIN Employee.Pay EP ON E.EmployeeID = EP.EmployeeID
WHERE EP.JobTitle = 'Salesman' OR EP.JobTitle = 'Sales Support'
AND EP.Bonus >= 1000
ORDER BY EP.JobTitle, EP.Bonus;
Explanation
Selected Columns: The query selects LastName, FirstName, and City from the Employee table, and JobTitle and Bonus from the Pay table. This combination provides personal details and job-related financial information.
INNER JOIN: The INNER JOIN clause combines records from the Employee and Pay tables based on the EmployeeID, ensuring that only employees with matching IDs in both tables are included.
Filtering with WHERE Clause: The query applies the following filters:
(EP.JobTitle = 'Salesman' OR EP.JobTitle = 'Sales Support'): This condition restricts the results to employees who hold either the ‘Salesman’ or ‘Sales Support’ job titles.AND EP.Bonus >= 1000: This condition further filters the results to include only those employees who have received a bonus of at least 1,000.
Ordering with ORDER BY Clause: The results are ordered first by JobTitle and then by Bonus in ascending order. This sorting helps organise the data, making it easier to compare employees within the same job title category based on their bonus amounts.
5. Employee Tenure and Salary Analysis
In a company, you want to analyse the tenure and salaries of employees in a specific role and also sorted by job title and salary amount. You have two tables: Employee.Employee and Employee.pay. Create a report that lists employee details for the role of ‘Salesman’ or sales support’ and sorts the results by job title and salary. Additionally, calculate the tenure (in years) of each employee from their Hire Date to the current date.
Sample solution
SELECT E.LastName,
E.FirstName,
E.City,
EP.JobTitle,
EP.Salary,
DATEDIFF (YEAR, EP.HireDate, GETDATE()) AS TenureInYears
FROM Employee.Employee E
INNER JOIN Employee.Pay EP ON E.EmployeeID = EP.EmployeeID
WHERE EP.JobTitle = 'Salesman' or EP.JobTitle = 'Sales Support'
ORDER BY EP.JobTitle, EP.Salary;
Explanation
Selected Columns:
LastName,FirstName, andCityare selected from theEmployeetable to provide personal details about each employee.JobTitleandSalaryare selected from thePaytable to provide job-related and financial information.DATEDIFF(YEAR, EP.HireDate, GETDATE()) AS TenureInYearscalculates the number of years each employee has been with the company, using the difference between their hire date and the current date. This result is labeled asTenureInYears.
INNER JOIN:
- The
INNER JOINclause combines records from theEmployeeandPaytables based on theEmployeeID, ensuring only employees with matching IDs in both tables are included.
Filtering with WHERE Clause:
- The condition
(EP.JobTitle = 'Salesman' OR EP.JobTitle = 'Sales Support')restricts the results to include only employees with the job titles ‘Salesman’ or ‘Sales Support’.
Ordering with ORDER BY Clause:
- The results are ordered first by
JobTitleand then bySalaryin ascending order. This sorting helps organise the data, making it easier to analyse and compare employees within the same job title category based on their salary.
6. Customer Order Analysis
In a retail business, you want to analyse customer orders, including the product details, for the cities from which orders are made, sorted by order date and quantity. You have three tables: CustomerTab.CustomerTabl, CustomerTab.CustomerOrdersTabl, and CustomerTab.CustomerProductTabl. Create a report that lists customer orders and includes product details. Sort the results by order date and order quantity in any order.
Sample solution
SELECT C.CustomerName,
C.City,
CO.OrderDate,
P.ProductDescription,
CO.OrderQuantity
FROM CustomerTab.CustomerTabl C
INNER JOIN CustomerTab.CustomerOrdersTabl CO ON C.CustomerID = CO.CustomerID
INNER JOIN CustomerTab.CustomerProductTabl P ON CO.ProductID = P.ProductID
ORDER BY CO.OrderDate, CO.OrderQuantity;
Explanation
This SQL query retrieves customer names, cities, order dates, product descriptions, and order quantities by joining three tables: CustomerTab.CustomerTabl (aliased as C), CustomerTab.CustomerOrdersTabl (aliased as CO), and CustomerTab.CustomerProductTabl (aliased as P).
It uses INNER JOIN operations to combine related information from these tables. The results are then sorted by order date and order quantity.
- Selected Columns:
CustomerNameandCityare selected from theCustomerTabltable to provide customer details.OrderDateandOrderQuantityare selected from theCustomerOrdersTabltable to provide information about the order’s date and quantity.ProductDescriptionis selected from theCustomerProductTabltable to provide details about the product ordered.
- INNER JOIN Operations:
- The first
INNER JOINlinks theCustomerTablandCustomerOrdersTabltables using theCustomerIDto ensure that each order is matched with the correct customer. - The second
INNER JOINlinks theCustomerOrdersTablandCustomerProductTabltables using theProductIDto match each order with the correct product details.
- The first
- Ordering with
ORDER BYClause:- The results are ordered first by
OrderDateand then byOrderQuantityin ascending order. This sorting helps in organising the data chronologically and by the number of products ordered, making it easier to analyse order trends and customer purchasing behaviour.
- The results are ordered first by
LEFT and RIGHT JOINS
7. Customer Order Analysis with Missing Orders
In a retail business, you want to analyse customer orders, including the product details, for all customers, even if they haven’t placed any orders. You have three tables: CustomerTab.CustomerTabl, CustomerTab.CustomerOrdersTabl, and CustomerTab.CustomerProductTabl. Create a report that lists all customers and their orders (if any), including product details. Sort the results by customer name, order date, and product description.
Sample solution
SELECT C.CustomerName,
C.City,
CO.OrderDate,
P.ProductDescription,
CO.OrderQuantity
FROM CustomerTab.CustomerTabl C
LEFT JOIN CustomerTab.CustomerOrdersTabl CO ON C.CustomerID = CO.CustomerID
LEFT JOIN CustomerTab.CustomerProductTabl P ON CO.ProductID = P.ProductID
ORDER BY C.CustomerName, CO.OrderDate, P.ProductDescription;
Explanation
This SQL query retrieves customer names, cities, order dates, product descriptions, and order quantities by joining three tables: CustomerTab.CustomerTabl (aliased as C), CustomerTab.CustomerOrdersTabl (aliased as CO), and CustomerTab.CustomerProductTabl (aliased as P).
It uses LEFT JOIN operations to include all customers, even if they have no corresponding orders or products.
The results are then sorted by customer name, order date, and product description.
- Selected Columns:
CustomerNameandCityare selected from theCustomerTabltable to provide customer details.OrderDateandOrderQuantityare selected from theCustomerOrdersTabltable to provide information about the date of the order and the quantity ordered.ProductDescriptionis selected from theCustomerProductTabltable to provide details about the product ordered.
- LEFT JOIN Operations:
- The first
LEFT JOINlinks theCustomerTablandCustomerOrdersTabltables using theCustomerID. This join includes all customers, even those who have not placed any orders. - The second
LEFT JOINlinks theCustomerOrdersTablandCustomerProductTabltables using theProductID. This join includes all orders, even if they are not associated with a product in the product table.
- The first
- Ordering with
ORDER BYClause:- The results are ordered first by
CustomerName, then byOrderDate, and finally byProductDescriptionin ascending order. This sorting provides a clear, organised view of the data, making it easier to see customer order patterns and the products they are interested in.
- The results are ordered first by
8. Customer Order Analysis with Optional Customers
In a retail business, you want to analyse customer orders, including the product details, for all orders, even if the customers’ information is missing. You have three tables: CustomerTab.CustomerTabl, CustomerTab.CustomerOrdersTabl, and CustomerTab.CustomerProductTabl. Create a report that lists all customer orders (if any) and includes customer information (if available), along with product details. Sort the results by customer name, order date, and product description.
Sample solution
SELECT C.CustomerName,
C.City,
CO.OrderDate,
P.ProductDescription,
CO.OrderQuantity
FROM CustomerTab.CustomerOrdersTabl CO
RIGHT JOIN CustomerTab.CustomerTabl C ON CO.CustomerID = C.CustomerID
LEFT JOIN CustomerTab.CustomerProductTabl P ON CO.ProductID = P.ProductID
ORDER BY C.CustomerName, CO.OrderDate, P.ProductDescription;
Explanation
This SQL query retrieves customer names, cities, order dates, product descriptions, and order quantities by combining information from three tables: CustomerTab.CustomerOrdersTabl (aliased as CO), CustomerTab.CustomerTabl (aliased as C), and CustomerTab.CustomerProductTabl (aliased as P).
It uses RIGHT JOIN and LEFT JOIN operations to ensure all customers are included, even if they have no orders or product details.
The results are then sorted by customer name, order date, and product description.
- Selected Columns:
CustomerNameandCityare selected from theCustomerTabltable to provide customer details.OrderDateandOrderQuantityare selected from theCustomerOrdersTabltable to provide information about when the order was placed and how many items were ordered.ProductDescriptionis selected from theCustomerProductTabltable to provide details about the product ordered.
- RIGHT JOIN and LEFT JOIN Operations:
- The
RIGHT JOINbetweenCustomerOrdersTabl(CO) andCustomerTabl(C) ensures that all customers are included, even those who have not placed any orders. It links the orders to customers based onCustomerID. - The
LEFT JOINbetweenCustomerOrdersTabl(CO) andCustomerProductTabl(P) includes all orders, even if they are not associated with a product, linking orders to products usingProductID.
- The
- Ordering with
ORDER BYClause:- The results are ordered first by
CustomerName, then byOrderDate, and finally byProductDescriptionin ascending order. This sorting provides a clear, organised view of the data, making it easier to understand customer order patterns and the products they are interested in.
- The results are ordered first by
FULL/SELF/OUTER/CROSS JOINS
9. Customer-Order Relationship Analysis
In your business, you want to analyse the relationship between customers and their orders. You have two tables: CustomerTab.CustomerTabl and CustomerTab.CustomerOrdersTabl. Create a comprehensive report that lists all customers and their orders, including those customers who haven’t placed any orders yet and those orders that have no associated customer information. Sort the results alphabetically by customer name and by order date.
Sample solution
SELECT C.CustomerName,
C.Address,
C.City,
C.ZipCode,
C.Phone,
CO.OrderID,
CO.OrderQuantity,
CO.OrderDate
FROM CustomerTab.CustomerTabl C
FULL JOIN CustomerTab.CustomerOrdersTabl CO ON C.CustomerID = CO.CustomerID
ORDER BY C.CustomerName, CO.OrderDate;
Explanation
This SQL query retrieves customer details and their corresponding order information by using a FULL JOIN between the CustomerTab.CustomerTabl (aliased as C) and CustomerTab.CustomerOrdersTabl (aliased as CO) tables.
The query includes all customers and all orders, even if they do not have matching records in both tables.
The results are then sorted by customer name and order date.
- Selected Columns:
CustomerName,Address,City,ZipCode, andPhoneare selected from theCustomerTabltable to provide comprehensive customer details.OrderID,OrderQuantity, andOrderDateare selected from theCustomerOrdersTabltable to provide information about the customer’s orders, including order identifiers, quantities, and dates.
- FULL JOIN Operation:
- The
FULL JOINbetweenCustomerTabl(C) andCustomerOrdersTabl(CO) ensures that all customers and all orders are included in the result set, regardless of whether there is a corresponding match in the other table. If a customer has no orders, the order details will beNULL. Similarly, if an order does not have a corresponding customer record, the customer details will beNULL.
- The
- Ordering with
ORDER BYClause:- The results are ordered first by
CustomerNameand then byOrderDatein ascending order. This sorting provides a clear, organised view of the data, making it easier to track customer activities and order histories.
- The results are ordered first by
10. Employee Carpooling Analysis
In your company, you want to promote carpooling among employees who live in the same city to reduce transportation costs and environmental impact. Identify pairs of employees who live in the same city and can potentially carpool together. Create a list of these employee pairs, along with their contact information. Use the Employee.Employee table.
Sample solution
SELECT E1. EmployeeID AS Employee1ID,
E1. LastName AS Employee1LastName,
E1. FirstName AS Employee1FirstName,
E1. Phone AS Employee1Phone,
E2. EmployeeID AS Employee2ID,
E2. LastName AS Employee2LastName,
E2. FirstName AS Employee2FirstName,
E2. Phone AS Employee2Phone,
E1. City AS CommonCity
FROM Employee.Employee E1
INNER JOIN Employee.Employee E2 ON E1. City = E2. City AND E1. EmployeeID < E2.
EmployeeID;
Explanation
This SQL query retrieves pairs of employees who live in the same city, providing details about each employee in the pair.
It uses a self-join on the Employee.Employee table to find employees with a common city, ensuring that each pair is listed only once.
The results include the employee IDs, last names, first names, and phone numbers for both employees, as well as the city they have in common.
- Selected Columns:
EmployeeID,LastName,FirstName, andPhonefromE1(aliased asEmployee1ID,Employee1LastName,Employee1FirstName,Employee1Phone) are selected to provide details about the first employee in each pair.EmployeeID,LastName,FirstName, andPhonefromE2(aliased asEmployee2ID,Employee2LastName,Employee2FirstName,Employee2Phone) are selected to provide details about the second employee in each pair.CityfromE1(aliased asCommonCity) is selected to show the city that both employees have in common.
- Self-Join Operation:
- The
INNER JOINoperation is performed on theEmployee.Employeetable, withE1andE2being aliases representing different instances of the same table. - The join condition
E1.City = E2.Cityfinds pairs of employees who live in the same city. - The condition
E1.EmployeeID < E2.EmployeeIDensures that each pair is listed only once, avoiding duplicate pairs in reverse order.
- The
11. Product Analysis with Missing Order Quantity
In a retail business, you want to analyse customer orders, including the product details, even if there might be missing orders for certain products. You have two tables: CustomerTab.CustomerOrdersTabl, and CustomerTab.CustomerProductTabl. Create a report that lists all product descriptions and their orders (if any).
Sample solution
SELECT P.ProductDescription, O.OrderQuantity
FROM CustomerTab.CustomerProductTabl P
LEFT OUTER JOIN CustomerTab.CustomerOrdersTabl O
ON P.ProductID = O.ProductID;
Explanation
This SQL query retrieves product descriptions and their corresponding order quantities by joining the CustomerTab.CustomerProductTabl table (aliased as P) with the CustomerTab.CustomerOrdersTabl table (aliased as O).
It uses a LEFT OUTER JOIN to ensure that all products are included in the results, even if they have not been ordered.
- Selected Columns:
ProductDescriptionis selected from theCustomerProductTabltable to provide details about the products.OrderQuantityis selected from theCustomerOrdersTabltable to show the quantity of each product ordered.
- LEFT OUTER JOIN Operation:
- The
LEFT OUTER JOINbetweenCustomerProductTabl(P) andCustomerOrdersTabl(O) ensures that all products are listed in the result set, including those that have not been ordered. If a product has no corresponding order in theCustomerOrdersTabltable, theOrderQuantitywill beNULL. - The join condition
P.ProductID = O.ProductIDlinks products with their corresponding orders based on theProductID.
- The
12. Total Compensation Report for HR Analysis: Salary and Bonus
In a human resources analysis project, you have two tables: Employee.Employee and Employee.Pay. You want to calculate the total compensation for each employee, which includes their salary and bonus. You need to create a report that shows the total compensation for each employee.
Sample solution
SELECT E.EmployeeID,
E.LastName,
E.FirstName,
(EP.Salary + EP.Bonus) AS TotalCompensation
FROM Employee.Employee E
CROSS JOIN Employee.Pay EP
ORDER BY E.EmployeeID;
Explanation
This SQL query retrieves a combination of employee details and total compensation by performing a CROSS JOIN between the Employee.Employee table (aliased as E) and the Employee.Pay table (aliased as EP).
It calculates the total compensation for each combination of employees and pay records by adding the salary and bonus.
The results are then sorted by employee ID.
- Selected Columns:
EmployeeID,LastName, andFirstNameare selected from theEmployeetable to provide identification and personal details for each employee.(EP.Salary + EP.Bonus) AS TotalCompensationcalculates the total compensation by summing theSalaryandBonusfrom thePaytable. This result is given the aliasTotalCompensation.
- CROSS JOIN Operation:
- The
CROSS JOINproduces a Cartesian product of theEmployeeandPaytables, meaning that each row from theEmployeetable is combined with every row from thePaytable. This results in every possible combination of employees and pay records, regardless of whether there is a logical match. - This type of join is typically used when there is no relationship between the two tables, or when generating all possible combinations is required for analysis or reporting.
- The
- Ordering with
ORDER BYClause:- The results are ordered by
EmployeeIDin ascending order. This sorting helps organise the data, making it easier to locate information based on employee ID.
- The results are ordered by
SUBQUERY
13. Identifying Employees with Highest Bonuses
In a company’s human resources analysis project, you have two tables: Employee.Employee and Employee.Pay. The company is interested in identifying employees with the highest bonuses. They want to create a report that lists the top five employees with the highest bonuses and includes their names and bonus amounts.
Sample solution
SELECT
E.LastName,
E.FirstName,
EP.Bonus
FROM Employee.Employee E
INNER JOIN Employee.Pay EP ON E.EmployeeID = EP.EmployeeID
WHERE EP.Bonus IN (
SELECT TOP 5 Bonus
FROM Employee.Pay
)
ORDER BY EP.Bonus DESC;
Explanation
This SQL query retrieves the last names, first names, and bonus amounts of employees by joining the Employee.Employee table (aliased as E) with the Employee.Pay table (aliased as EP).
The query focuses on identifying employees who have received one of the top 5 highest bonuses.
It uses a subquery to find these top bonuses and sorts the results in descending order of the bonus amount.
- Selected Columns:
LastNameandFirstNameare selected from theEmployeetable to provide the personal details of each employee.Bonusis selected from thePaytable to show the bonus amount each employee received.
- INNER JOIN Operation:
- The
INNER JOINlinks theEmployeeandPaytables using theEmployeeID, ensuring that only employees with matching IDs in both tables are included in the results.
- The
- Filtering with
WHEREClause and Subquery:WHERE EP.Bonus IN (...): This condition filters the results to include only those employees whose bonus is among the top 5 highest bonuses.SELECT TOP 5 Bonus FROM Employee.Pay: This subquery selects the top 5 highest bonus amounts from thePaytable. TheTOP 5clause ensures that only the highest 5 bonuses are considered.
- Ordering with
ORDER BYClause:ORDER BY EP.Bonus DESC: The results are sorted in descending order by the bonus amount, so the highest bonuses appear first.
14. Identifying Customers with High Total Order Quantities
You want to find customers who have placed orders with a total quantity greater than a certain threshold. Assuming we want to find customers, who have placed orders with a total order quantity greater than 25. Use the CustomerTabl and CustomerOrdersTabl tables.
Sample solution
SELECT CustomerName
FROM CustomerTab.CustomerTabl
WHERE CustomerID IN (
SELECT CustomerID
FROM CustomerTab.CustomerOrdersTabl
GROUP BY CustomerID
HAVING SUM(OrderQuantity) > 25
);
Explanation
This SQL query retrieves the names of customers who have placed orders with a total quantity exceeding 25 items.
It uses a subquery to identify customers who meet this criterion based on their order records, and then selects the customer names from the CustomerTab.CustomerTabl table.
- Selected Column:
CustomerNameis selected from theCustomerTab.CustomerTabltable, providing the names of customers who meet the specified order quantity condition.
- Filtering with
WHEREClause and Subquery:WHERE CustomerID IN (...): This condition filters the results to include only customers whose IDs match those returned by the subquery.- The subquery
SELECT CustomerID FROM CustomerTab.CustomerOrdersTabl GROUP BY CustomerID HAVING SUM(OrderQuantity) > 25identifies customers from theCustomerOrdersTabltable who have placed orders totalling more than 25 items.GROUP BY CustomerID: Groups the orders by customer.HAVING SUM(OrderQuantity) > 25: Ensures that only customers with a total order quantity greater than 25 are included.
15. Customer Order Analysis: Total Product Cost and Top Spender
Calculate the total cost of products ordered by each customer and identify the customers who have spent the most on their orders. Use the OrdersTabl and ProductTabl.
Sample solution
SELECT
CustomerID,
SUM(order_total) AS total_spent
FROM (
SELECT
o.CustomerID,
p.Cost * o.OrderQuantity AS order_total
FROM
CustomerTab.CustomerOrdersTabl o
JOIN
CustomerTab.CustomerProductTabl p ON o.ProductID = p.ProductID
) AS customer_orders
GROUP BY
CustomerID
ORDER BY
total_spent DESC;
Explanation
This SQL query calculates the total amount spent by each customer by combining information from the CustomerOrdersTabl and CustomerProductTabl tables.
It first calculates the total for each order, and then sums these totals by customer. The results are sorted in descending order of the total amount spent.
- Main Query:
CustomerIDis selected to identify each customer.SUM(order_total) AS total_spentcalculates the total amount spent by each customer by summing up the values oforder_total. The result is labelled astotal_spent.
- Subquery (
customer_orders):- The subquery calculates the total cost of each order by multiplying the
Costof the product from theCustomerProductTabltable with theOrderQuantityfrom theCustomerOrdersTabltable. JOINclause: This join links each order to its corresponding product using theProductID.o.CustomerID: Refers to the customer who placed the order.p.Cost * o.OrderQuantity AS order_total: Calculates the total cost of each order by multiplying the product’s cost by the quantity ordered.
- The subquery calculates the total cost of each order by multiplying the
- GROUP BY Clause:
GROUP BY CustomerID: Groups the results by customer, allowing the query to calculate the total amount spent by each individual customer.
- Ordering with
ORDER BYClause:ORDER BY total_spent DESC: The results are sorted in descending order by the total amount spent, so the customers who have spent the most appear first.
16. Identifying Unordered Products: Customer and Product Analysis
Find the products that have never been ordered by any customer. Use the OrdersTabl and ProductTabl.
Sample solution
SELECT
p.ProductID,
p.ProductDescription
FROM
CustomerTab.CustomerProductTabl p
LEFT JOIN
(
SELECT DISTINCT
ProductID
FROM
CustomerTab.CustomerOrdersTabl
) AS ordered_products
ON
p.ProductID = ordered_products.ProductID
WHERE
ordered_products.ProductID IS NULL;
Explanation
This SQL query retrieves a list of products that have not been ordered by any customers.
It uses a LEFT JOIN to combine the CustomerProductTabl table (aliased as p) with a subquery that identifies all products that have been ordered, ensuring that only products without orders are included in the result.
- Selected Columns:
ProductIDandProductDescriptionare selected from theCustomerProductTabltable to provide the ID and description of each product.
- Subquery (
ordered_products):- The subquery selects distinct
ProductIDvalues from theCustomerOrdersTabltable, identifying products that have been ordered at least once. SELECT DISTINCT ProductID FROM CustomerTab.CustomerOrdersTabl: This ensures that each product ID appears only once, regardless of how many times it has been ordered.
- The subquery selects distinct
- LEFT JOIN Operation:
- The
LEFT JOINis used to join theCustomerProductTabltable with theordered_productssubquery. This join includes all products from theCustomerProductTabltable, even if they do not have a matching entry in theordered_productssubquery. ON p.ProductID = ordered_products.ProductID: This condition matches products from the product table with the ordered products subquery based onProductID.
- The
- Filtering with
WHEREClause:WHERE ordered_products.ProductID IS NULL: This condition filters the results to include only those products that do not have a correspondingProductIDin theordered_productssubquery. These are products that have not been ordered.
17. Customer Average Order Cost Analysis with Threshold
Calculate the average cost of products ordered by each customer, and then identify customers whose average order cost is above a threshold of 50. Use the OrdersTabl and ProductTabl.
Sample solution
SELECT
CustomerID,
AVG(order_total) AS average_order_cost
FROM (
SELECT
o.CustomerID,
p.Cost * o.OrderQuantity AS order_total
FROM
CustomerTab.CustomerOrdersTabl o
JOIN
CustomerTab.CustomerProductTabl p ON o.ProductID = p.ProductID
) AS customer_orders
GROUP BY
CustomerID
HAVING
AVG(order_total) > 50;
Explanation
This SQL query calculates the average order cost for each customer by joining the CustomerOrdersTabl table (aliased as o) with the CustomerProductTabl table (aliased as p).
It only includes customers whose average order cost exceeds £50. The query uses a subquery to compute the total cost of each order before calculating the average order cost per customer.
- Main Query:
CustomerIDis selected to identify each customer.AVG(order_total) AS average_order_costcalculates the average total cost of orders placed by each customer. The result is labelled asaverage_order_cost.
- Subquery (
customer_orders):- The subquery calculates the total cost of each order by multiplying the
Costof the product from theCustomerProductTabltable by theOrderQuantityfrom theCustomerOrdersTabltable. JOINclause: This join links each order to its corresponding product using theProductID.o.CustomerID: Refers to the customer who placed the order.p.Cost * o.OrderQuantity AS order_total: Calculates the total cost of each order by multiplying the product’s cost by the quantity ordered.
- The subquery calculates the total cost of each order by multiplying the
- GROUP BY Clause:
GROUP BY CustomerID: Groups the results by customer, allowing the query to calculate the average order cost for each individual customer.
- Filtering with
HAVINGClause:HAVING AVG(order_total) > 50: This condition filters the results to include only those customers whose average order cost is greater than £50.
18. Average Salary Analysis for Employees
Find the average salary for employees who joined the company in the same year as the employee with the highest salary, and also provide the count of such employees. Use the Employee.Pay table.
Sample solution
SELECT AVG(EP.Salary) AS AverageSalary, COUNT(*) AS EmployeeCount
FROM Employee.Pay AS EP
WHERE YEAR(EP.HireDate) = (
SELECT YEAR(HireDate)
FROM Employee.Pay
WHERE Salary = (
SELECT MAX(Salary)
FROM Employee.Pay
)
);
Explanation
This SQL query calculates the average salary and counts the number of employees hired in the same year as the employee with the highest salary.
It involves multiple levels of subqueries to determine the relevant year and then uses this information to filter the employees accordingly.
- Main Query:
AVG(EP.Salary) AS AverageSalary: Calculates the average salary of employees hired in a specific year, labelling the result asAverageSalary.COUNT(*) AS EmployeeCount: Counts the total number of employees hired in that same year, labelling the result asEmployeeCount.
- Filtering with
WHEREClause:WHERE YEAR(EP.HireDate) = (...): This condition filters the main query to include only those employees hired in a particular year, which is determined by a subquery.
- Subquery Structure:
- The first subquery
SELECT YEAR(HireDate) FROM Employee.Pay WHERE Salary = (...)identifies the year in which the employee with the highest salary was hired.- The innermost subquery
SELECT MAX(Salary) FROM Employee.Payfinds the maximum salary in theEmployee.Paytable. - The outer subquery then finds the
HireDateof the employee with this maximum salary and extracts the year.
- The innermost subquery
- The first subquery
19. Promotion Eligibility Analysis
Identify employees who are eligible for a promotion based on the following criteria: they must have been with the company for at least five years, and their current salary is below the average salary of all employees in the same job title. Use the Employee and Employee.Pay tables.
Sample solution
SELECT E.EmployeeID, E.FirstName, E.LastName, EP.JobTitle, EP.Salary
FROM Employee.Employee AS E
INNER JOIN Employee.Pay AS EP ON E.EmployeeID = EP.EmployeeID
WHERE EP.HireDate <= DATEADD(YEAR, -5, GETDATE())
AND EP.Salary < (
SELECT AVG (EP2.Salary)
FROM Employee.Pay AS EP2
WHERE EP2.JobTitle = EP.JobTitle
);
Explanation
This SQL query retrieves details of employees who have been employed for at least 5 years and earn a salary below the average for their specific job title.
It combines data from the Employee.Employee table (aliased as E) and the Employee.Pay table (aliased as EP) using an INNER JOIN.
The query uses subqueries to compare each employee’s salary against the average salary for their job title.
- Selected Columns:
EmployeeID,FirstName, andLastNameare selected from theEmployeetable to provide identification and personal details for each employee.JobTitleandSalaryare selected from thePaytable to provide job-related details and salary information.
- INNER JOIN Operation:
- The
INNER JOINlinks theEmployeeandPaytables using theEmployeeID, ensuring that only employees with matching IDs in both tables are included in the results.
- The
- Filtering with
WHEREClause:EP.HireDate <= DATEADD(YEAR, -5, GETDATE()): This condition filters the results to include only employees who were hired at least 5 years ago. TheDATEADD(YEAR, -5, GETDATE())function calculates the date 5 years before the current date.AND EP.Salary < (...): This condition filters the results to include only those employees whose salary is below the average salary for their job title.- The subquery
SELECT AVG(EP2.Salary) FROM Employee.Pay AS EP2 WHERE EP2.JobTitle = EP.JobTitlecalculates the average salary for each job title. It compares the employee’s salary against this average, filtering out those who earn less than the average.
- The subquery
20. Identifying High-Value Customers
A retail company wants to analyse its customer base to identify high-value customers. To do this, they need to find the top 10 customers who have placed the highest total quantity of orders. Additionally, they want to know the addresses of these top 10 customers. Use the CustomerTabl and OrdersTabl.
Sample solution
SELECT
c.CustomerName,
c.Address
FROM
CustomerTab.CustomerTabl c
WHERE
c.CustomerID IN (
SELECT TOP 10
o.CustomerID
FROM
CustomerTab.CustomerOrdersTabl o
GROUP BY
o.CustomerID
ORDER BY
SUM(o.OrderQuantity) DESC
);
Explanation
This SQL query retrieves the names and addresses of the top 10 customers who have placed the largest total order quantities.
It uses a subquery to identify these top customers based on their order quantities and filters the main query to include only those customers.
- Selected Columns:
CustomerNameandAddressare selected from theCustomerTabltable to provide the names and addresses of the top customers.
- Filtering with
WHEREClause:WHERE c.CustomerID IN (...): This condition filters the main query to include only those customers whose IDs are in the list returned by the subquery.
- Subquery Structure:
- The subquery
SELECT TOP 10 o.CustomerID FROM CustomerTab.CustomerOrdersTabl o GROUP BY o.CustomerID ORDER BY SUM(o.OrderQuantity) DESCidentifies the top 10 customers based on the total quantity of items they have ordered.GROUP BY o.CustomerID: Groups the orders by customer, allowing the query to aggregate order quantities.ORDER BY SUM(o.OrderQuantity) DESC: Orders the results by the total order quantity in descending order, so customers with the highest order quantities appear first.SELECT TOP 10: Limits the result to the top 10 customers.
- The subquery
UNION/INTERSECT/EXCEPT Operators
21. Analyse top selling products
A retail company wants to create a consolidated list of top-selling and least-selling products from their inventory. They also want to include the product cost in the report. However, the data is stored in a single table: The Product table. To create this report, they need to combine the necessary information from the Product table into a single result set.
Sample solution
SELECT
ProductID,
ProductDescription,
Cost,
'Top-Selling' AS SalesCategory
FROM
CustomerTab.CustomerProductTabl
WHERE
ProductID IN (
SELECT TOP 5
ProductID
FROM
CustomerTab.CustomerProductTabl
ORDER BY
Cost DESC
)
UNION
-- Query to retrieve least-selling products
SELECT
ProductID,
ProductDescription,
Cost,
'Least-Selling' AS SalesCategory
FROM
CustomerTab.CustomerProductTabl
WHERE
ProductID IN (
SELECT TOP 5
ProductID
FROM
CustomerTab.CustomerProductTabl
ORDER BY
Cost ASC
);
Explanation
This SQL query retrieves the top 5 most expensive and top 5 least expensive products from the CustomerTab.CustomerProductTabl table and categorises them as either ‘Top-Selling’ or ‘Least-Selling’ based on their cost.
The query uses two separate subqueries to identify these products and combines the results using a UNION.
- Selected Columns:
ProductID,ProductDescription, andCostare selected from theCustomerProductTabltable to provide details about each product.'Top-Selling' AS SalesCategoryand'Least-Selling' AS SalesCategoryare hardcoded string values used to label the products as ‘Top-Selling’ or ‘Least-Selling’ based on the subquery they are part of.
- Subquery for Top-Selling Products:
SELECT TOP 5 ProductID FROM CustomerTab.CustomerProductTabl ORDER BY Cost DESC: This subquery selects the top 5 most expensive products.ORDER BY Cost DESC: Orders the products by cost in descending order to identify the most expensive products.
- Subquery for Least-Selling Products:
SELECT TOP 5 ProductID FROM CustomerTab.CustomerProductTabl ORDER BY Cost ASC: This subquery selects the top 5 least expensive products.ORDER BY Cost ASC: Orders the products by cost in ascending order to identify the least expensive products.
- UNION Operator:
- The
UNIONoperator combines the results of the two queries into a single result set. It ensures that the combined results do not include duplicate rows, but since each product is assigned a uniqueSalesCategory, duplicates are unlikely.
- The
22. Combining Product and Customer Data for Marketing in a Specific City
A company wants to create a single list of all products and customers that are associated with a particular address for marketing purposes. However, the data is stored in two separate tables: Product table and Customer table. To achieve this, they need to combine the relevant information from both tables into a single result set for a specific city.
Sample solution
SELECT
ProductID,
ProductDescription AS Name,
NULL AS Address
FROM
CustomerTab.CustomerProductTabl
UNION
-- Query to retrieve customers from the specified city
SELECT
CustomerID,
CustomerName AS Name,
City AS Location
FROM
CustomerTab.CustomerTabl
Explanation
This SQL query combines information about products and customers into a single result set using the UNION operator.
It selects product details from the CustomerProductTabl table and customer details from the CustomerTabl table, ensuring the results share the same structure by using aliases and placeholder values.
- First Query (Product Information):
ProductIDis selected to identify each product uniquely.ProductDescription AS Namerenames theProductDescriptioncolumn toNameto match the structure of the customer query.NULL AS Address: This column is included to match the structure of the second query. Since products do not have an address,NULLis used as a placeholder.
- Second Query (Customer Information):
CustomerIDis selected to identify each customer uniquely.CustomerName AS Namerenames theCustomerNamecolumn toNameto match the structure of the product query.City AS Location: This column provides the location of each customer, serving a similar purpose to theNULLplaceholder in the first query, but here it includes actual data.
- UNION Operator:
- The
UNIONoperator combines the results of the two queries into a single result set. It removes duplicate rows, if any, ensuring that each unique row is displayed only once.
- The
23. Identify Customers Who Have Not Ordered
A company wants to identify customers who have never placed an order. They have customer information stored in the Customer table and order information in the Order table. To find customers who have not placed orders, they need to combine information from both sources and identify customers who do not have any corresponding orders.
Sample solution
SELECT
c.CustomerID,
c.CustomerName,
c.Address,
c.City
FROM
CustomerTab.CustomerTabl c
EXCEPT
-- Query to retrieve customers who have placed orders
SELECT
c.CustomerID,
c.CustomerName,
c.Address,
c.City
FROM
CustomerTab.CustomerTabl c
JOIN
CustomerTab.CustomerOrdersTabl o
ON
c.CustomerID = o.CustomerID;
Explanation
This SQL query retrieves a list of customers who have not placed any orders.
It uses the EXCEPT operator to find the difference between two result sets: the first set containing all customers, and the second set containing only those customers who have placed orders.
The EXCEPT operator ensures that only customers without orders are returned.
- First Query (All Customers):
CustomerID,CustomerName,Address, andCityare selected from theCustomerTabltable to provide details about all customers.
- Second Query (Customers Who Have Placed Orders):
CustomerID,CustomerName,Address, andCityare selected from theCustomerTabltable joined with theCustomerOrdersTabltable.JOIN CustomerTab.CustomerOrdersTabl o ON c.CustomerID = o.CustomerID: ThisJOINlinks theCustomerTabltable to theCustomerOrdersTabltable using theCustomerID. This ensures that only customers who have placed orders are included in this result set.
- EXCEPT Operator:
- The
EXCEPToperator returns only the rows from the first query that are not present in the second query. This effectively filters out customers who have placed orders, leaving only those who have not.
- The
24. Identifying Unordered Products
A company wants to identify products that have never been ordered by any customers. They have product information stored in the Product table and order information in the Order table. To find products that have not been ordered, they need to combine information from both sources and identify products that do not have any corresponding orders.
Sample solution
SELECT
p.ProductID,
p.ProductDescription,
p.Cost
FROM
CustomerTab.CustomerProductTabl p
EXCEPT
-- Query to retrieve products that have been ordered
SELECT
p.ProductID,
p.ProductDescription,
p.Cost
FROM
CustomerTab.CustomerProductTabl p
JOIN
CustomerTab.CustomerOrdersTabl o
ON
p.ProductID = o.ProductID;
Explanation
This SQL query retrieves a list of products that have never been ordered.
It uses the EXCEPT operator to find the difference between two result sets: the first set containing all products, and the second set containing only those products that have been ordered.
The EXCEPT operator ensures that only products without any orders are returned.
- First Query (All Products):
ProductID,ProductDescription, andCostare selected from theCustomerProductTabltable to provide details about all products available.
- Second Query (Products That Have Been Ordered):
ProductID,ProductDescription, andCostare selected from theCustomerProductTabltable joined with theCustomerOrdersTabltable.JOIN CustomerTab.CustomerOrdersTabl o ON p.ProductID = o.ProductID: ThisJOINlinks theCustomerProductTabltable to theCustomerOrdersTabltable using theProductID. This ensures that only products that have been ordered are included in this result set.
- EXCEPT Operator:
- The
EXCEPToperator returns only the rows from the first query that are not present in the second query. This effectively filters out products that have been ordered, leaving only those that have not.
- The
ROLLUP AND CUBE Expressions
25. Payroll Expense Analysis
A company wants to analyse its payroll expenses and generate a report that provides insights into the total salary expenditure by job title and department. The company stores employee pay-related information in the Employee Pay table. To create a comprehensive payroll report, they need to calculate subtotals and a grand total of salary expenses, considering both job titles and departments.
Sample solution
SELECT
JobTitle,
EmployeeID,
SUM(Salary) as TotalSalary
FROM
Employee.Pay
GROUP BY ROLLUP (JobTitle, EmployeeID );
Explanation
This SQL query calculates the total salary for each employee and for each job title, using the ROLLUP feature to provide subtotals and a grand total.
The GROUP BY ROLLUP clause is used to group the results by JobTitle and EmployeeID, generating summary rows at different levels of aggregation.
- Selected Columns:
JobTitleis selected to group the results by the job titles of employees.EmployeeIDis selected to provide specific salary details for each employee within a job title.SUM(Salary) AS TotalSalarycalculates the total salary for each group, whether it’s per employee, per job title, or the grand total. The result is labelled asTotalSalary.
GROUP BY ROLLUPClause:- The
ROLLUP (JobTitle, EmployeeID)feature is used to generate grouped results with subtotals and a grand total:- Per Employee: It first groups the results by each
EmployeeIDwithin eachJobTitle. - Per Job Title: It then provides a subtotal for each
JobTitle, showing the total salary of all employees with that title. - Grand Total: Finally, it provides a grand total of salaries for all employees, regardless of their job titles.
- Per Employee: It first groups the results by each
- The
26. Analysis of customer purchase behaviour
A company wants to know the total number of orders placed by each customer, as well as the total quantity of each product ordered by each customer using the Order table.
Sample solution
SELECT CustomerID, ProductID,
COUNT(*) AS TotalOrders,
SUM(OrderQuantity) AS TotalQuantity
FROM CustomerTab.CustomerOrdersTabl
GROUP BY CustomerID, ProductID
WITH ROLLUP;
Explanation
This SQL query calculates the total number of orders and the total quantity of products ordered by each customer, using the ROLLUP feature to provide subtotals for each customer and a grand total.
The GROUP BY ROLLUP clause is used to group the results by CustomerID and ProductID, generating summary rows at different levels of aggregation.
- Selected Columns:
CustomerIDis selected to group the results by each customer, identifying which customer placed the orders.ProductIDis selected to group the results by each product, identifying which product was ordered.COUNT(*) AS TotalOrderscalculates the total number of orders placed by each customer for each product. The result is labelled asTotalOrders.SUM(OrderQuantity) AS TotalQuantitycalculates the total quantity of products ordered by each customer for each product. The result is labelled asTotalQuantity.
GROUP BY ROLLUPClause:- The
ROLLUP (CustomerID, ProductID)feature is used to generate grouped results with subtotals and a grand total:- Per Customer and Product: It first groups the results by each
ProductIDwithin eachCustomerID. - Per Customer: It then provides a subtotal for each
CustomerID, showing the total orders and quantity for all products ordered by that customer. - Grand Total: Finally, it provides a grand total for all customers and all products, showing the overall total orders and quantities.
- Per Customer and Product: It first groups the results by each
- The
27. Analyse Customer Purchase Behaviour by Month
A company wants to know the total number of orders placed by each customer, as well as the total quantity of each product ordered by each customer, grouped by month using the Order table.
Sample solution
SELECT CustomerID, ProductID, MONTH(OrderDate) AS OrderMonth,
COUNT(*) AS TotalOrders,
SUM(OrderQuantity) AS TotalQuantity
FROM CustomerTab.CustomerOrdersTabl
GROUP BY CustomerID, ProductID, MONTH(OrderDate)
WITH ROLLUP;
Explanation
This SQL query calculates the total number of orders and the total quantity of products ordered by each customer for each product, broken down by the month in which the order was placed.
The query uses the ROLLUP feature to provide subtotals by customer, product, and month, as well as a grand total.
The GROUP BY ROLLUP clause is used to generate grouped results at different levels of aggregation.
- Selected Columns:
CustomerIDis selected to identify each customer.ProductIDis selected to identify each product ordered.MONTH(OrderDate) AS OrderMonthextracts the month from theOrderDateto show when the orders were placed. The result is labelled asOrderMonth.COUNT(*) AS TotalOrderscalculates the total number of orders placed by each customer for each product in each month. The result is labelled asTotalOrders.SUM(OrderQuantity) AS TotalQuantitycalculates the total quantity of products ordered by each customer for each product in each month. The result is labelled asTotalQuantity.
GROUP BY ROLLUPClause:- The
ROLLUP (CustomerID, ProductID, MONTH(OrderDate))feature generates grouped results with subtotals and a grand total:- Per Customer, Product, and Month: It first groups the results by each
ProductIDandOrderMonthwithin eachCustomerID. - Per Customer and Product: It provides subtotals for each
CustomerIDandProductID, showing total orders and quantity for all months. - Per Customer: It provides subtotals for each
CustomerID, showing total orders and quantity for all products and months. - Grand Total: Finally, it provides a grand total for all customers, products, and months, showing overall total orders and quantities.
- Per Customer, Product, and Month: It first groups the results by each
- The
28. Analyse Employee Salaries by Job Title
A company wants to know the total salary paid to each job title using the Employee Pay table.
Sample solution
SELECT JobTitle, SUM(Salary) AS TotalSalary
FROM Employee.Pay
GROUP BY JobTitle
WITH ROLLUP;
Explanation
This SQL query calculates the total salary paid to employees for each job title and provides a grand total for all job titles using the ROLLUP feature.
The GROUP BY ROLLUP clause groups the results by JobTitle, generating summary rows at different levels of aggregation.
- Selected Columns:
JobTitleis selected to identify each job title within the organisation.SUM(Salary) AS TotalSalarycalculates the total salary paid to all employees with a particular job title. The result is labelled asTotalSalary.
GROUP BY ROLLUPClause:- The
ROLLUP (JobTitle)feature generates grouped results with subtotals and a grand total:- Per Job Title: It groups the results by each
JobTitle, providing the total salary for each job title. - Grand Total: It provides a grand total of salaries for all job titles combined. This grand total row will have a
NULLvalue in theJobTitlecolumn, representing the overall sum of all salaries.
- Per Job Title: It groups the results by each
- The
29. Compensation and HR Analytics
A company wants to analyse its employee compensation data to gain insights into salary trends, job titles, and compensation expenses. They have two tables, the “Employee” table and the “EmployeePay” table.
Sample solution
SELECT
JobTitle AS Job_Title,
City AS City,
YEAR(HireDate) AS Hire_Year,
SUM(Salary) AS Total_Compensation_Expense
FROM
Employee.Pay
JOIN
Employee.Employee ON Employee.Pay.EmployeeID = Employee.Employee.EmployeeID
GROUP BY
CUBE (JobTitle, City, YEAR(HireDate))
ORDER BY
Job_Title, City, Hire_Year;
Explanation
This SQL query calculates the total salary expenses by job title, city, and hire year, using the CUBE feature to provide multiple levels of aggregation.
The query joins the Employee.Pay table with the Employee.Employee table to combine salary data with job title and location information.
The CUBE operator generates subtotals for every combination of job title, city, and hire year, including higher-level summaries.
- Selected Columns:
JobTitle AS Job_Titlerenames theJobTitlecolumn toJob_Titleto provide a clear and consistent format.City AS Cityselects the city where each employee works.YEAR(HireDate) AS Hire_Yearextracts the year from theHireDateto show when each employee was hired.SUM(Salary) AS Total_Compensation_Expensecalculates the total salary expense for each combination of job title, city, and hire year. The result is labelled asTotal_Compensation_Expense.
- JOIN Operation:
JOIN Employee.Employee ON Employee.Pay.EmployeeID = Employee.Employee.EmployeeID: This join combines thePayandEmployeetables using theEmployeeID, ensuring that salary data is matched with the corresponding job title, city, and hire date.
GROUP BY CUBEClause:- The
CUBE (JobTitle, City, YEAR(HireDate))feature generates grouped results with subtotals and a grand total:- Per Job Title, City, and Hire Year: It groups the results by every combination of
JobTitle,City, andHire_Year. - Subtotals: It provides subtotals for each
JobTitleacross all cities and years, eachCityacross all job titles and years, and eachHire_Yearacross all job titles and cities. - Grand Total: It provides a grand total for all job titles, cities, and hire years combined.
- Per Job Title, City, and Hire Year: It groups the results by every combination of
- The
- Ordering with
ORDER BYClause:- The results are ordered by
Job_Title,City, andHire_Year, providing a structured view of the salary expenses.
- The results are ordered by
30. Sales and Market Expansion
A retail company wants to analyse its sales data and customer information to make informed decisions about expanding its market presence. They have two tables, the “Order” table, and the “Customer” table. And maybe the product table too.
Sample solution
SELECT
p.ProductID AS Product,
c.City AS City,
YEAR(o.OrderDate) AS Order_Year,
SUM(o.OrderQuantity * p.Cost) AS "Revenue"
FROM
CustomerTab.CustomerOrdersTabl o
JOIN
CustomerTab.CustomerTabl c ON o.CustomerID = c.CustomerID
JOIN
CustomerTab.CustomerProductTabl p ON o.ProductID = p.ProductID
GROUP BY
CUBE (p.ProductID, c.City, YEAR(o.OrderDate))
ORDER BY
Product, City, Order_Year;
Explanation
This SQL query calculates the total revenue generated by each product, in each city, and for each year, using the CUBE feature to provide various levels of aggregation.
The query joins the CustomerOrdersTabl, CustomerTabl, and CustomerProductTabl tables to combine order data with customer and product details.
The CUBE operator generates subtotals for every combination of product, city, and year, as well as higher-level summaries.
- Selected Columns:
p.ProductID AS Productrenames theProductIDcolumn toProductto clearly indicate that this field represents the product being analysed.c.City AS Cityselects the city where the customer placed the order.YEAR(o.OrderDate) AS Order_Yearextracts the year from theOrderDateto show when the order was placed.SUM(o.OrderQuantity * p.Cost) AS "Revenue"calculates the total revenue by multiplying the order quantity by the product cost. The result is labelled as"Revenue".
- JOIN Operations:
JOIN CustomerTab.CustomerTabl c ON o.CustomerID = c.CustomerID: This join links the orders with customer details using theCustomerID, ensuring that each order is associated with the correct customer.JOIN CustomerTab.CustomerProductTabl p ON o.ProductID = p.ProductID: This join links the orders with product details using theProductID, ensuring that each order is associated with the correct product.
GROUP BY CUBEClause:- The
CUBE (p.ProductID, c.City, YEAR(o.OrderDate))feature generates grouped results with subtotals and a grand total:- Per Product, City, and Year: It groups the results by every combination of
ProductID,City, andOrder_Year. - Subtotals: It provides subtotals for each
ProductIDacross all cities and years, eachCityacross all products and years, and eachOrder_Yearacross all products and cities. - Grand Total: It provides a grand total for all products, cities, and years combined.
- Per Product, City, and Year: It groups the results by every combination of
- The
- Ordering with
ORDER BYClause:- The results are ordered by
Product,City, andOrder_Year, providing a structured and organised view of the revenue data.
- The results are ordered by
Other uses of CASE-WHEN-ELSE-END
31. Customer Loyalty Program Analysis
A retail company, “ShopSmart,” wants to analyse customer purchases to identify loyal customers and provide them with exclusive discounts. They have two tables, “Product” and “Order,” . Determine whether a customer is a loyal customer based on the total amount spent. A loyal customer is defined as someone who has spent more than 200 in total.
Sample solution
SELECT
CustomerID,
CASE
WHEN SUM(OrderQuantity * Cost) > 500 THEN 'Loyal Customer'
ELSE 'Regular Customer'
END AS CustomerStatus,
SUM(OrderQuantity * Cost) AS TotalAmountSpent
FROM CustomerTab.CustomerOrdersTabl
JOIN CustomerTab.CustomerProductTabl ON CustomerTab.CustomerOrdersTabl.ProductID =
CustomerTab.CustomerProductTabl.ProductID
GROUP BY CustomerID
HAVING SUM(OrderQuantity * Cost) > 200;
Explanation
This SQL query categorises customers based on the total amount they have spent and calculates the total amount spent by each customer.
Customers are labelled as either ‘Loyal Customer’ or ‘Regular Customer’ depending on their total spending.
The query uses a JOIN to combine order and product data, then groups the results by CustomerID and filters out customers who have spent less than £200 using the HAVING clause.
- Selected Columns:
CustomerIDis selected to identify each customer uniquely.CASE WHEN ... THEN ... ELSE ... END AS CustomerStatus: ThisCASEstatement categorises customers based on their spending:- If the total amount spent (
SUM(OrderQuantity * Cost)) is greater than £500, the customer is labelled as ‘Loyal Customer’. - Otherwise, the customer is labelled as ‘Regular Customer’.
- If the total amount spent (
SUM(OrderQuantity * Cost) AS TotalAmountSpentcalculates the total amount spent by each customer by multiplying the order quantity by the product cost. The result is labelled asTotalAmountSpent.
- JOIN Operation:
JOIN CustomerTab.CustomerProductTabl ON CustomerTab.CustomerOrdersTabl.ProductID = CustomerTab.CustomerProductTabl.ProductID: This join links the orders to the product details using theProductID, ensuring that the correct cost is applied to each order.
- GROUP BY Clause:
GROUP BY CustomerID: Groups the results by customer, allowing the query to calculate the total amount spent for each customer.
- Filtering with
HAVINGClause:HAVING SUM(OrderQuantity * Cost) > 200: This condition filters the results to include only those customers who have spent more than £200 in total.
32. Product Promotion Analysis
A retail company, “SaleSmart,” wants to analyse product sales data to identify which products should be included in a new promotional campaign. They have two tables, “Product” and “Order,” and need to identify products that meet specific criteria for promotion. Identify products that have generated total sales revenue exceeding 1,000. Determine which products have been sold more than 100 times. Identify products with a profit margin of at least 30%. Profit margin is defined as (Profit / Revenue) * 100, where Profit = Total Sales Revenue – Total Cost. Find products that have not been sold at all.
Sample solution
SELECT
ProductDescription,
Cost,
SUM(OrderQuantity * Cost) AS TotalRevenue,
SUM(OrderQuantity) AS TotalQuantitySold,
((SUM(OrderQuantity * Cost) - COUNT(OrderID) * Cost) / SUM(OrderQuantity *
Cost)) * 100 AS ProfitMargin,
CASE
WHEN SUM(OrderQuantity * Cost) > 500 THEN 'High Sales'
ELSE 'Low Sales'
END AS SalesCategory,
CASE
WHEN SUM(OrderQuantity) > 100 THEN 'High Demand'
ELSE 'Low Demand'
END AS DemandCategory,
CASE
WHEN ((SUM(OrderQuantity * Cost) - COUNT(OrderID) * Cost) / SUM
(OrderQuantity * Cost)) * 100 >= 30 THEN 'High Profit Margin'
ELSE 'Low Profit Margin'
END AS ProfitMarginCategory,
CASE
WHEN SUM(OrderQuantity) = 0 THEN 'Not Sold'
ELSE 'Sold'
END AS SoldStatus
FROM CustomerTab.CustomerOrdersTabl
JOIN CustomerTab.CustomerProductTabl ON CustomerTab.CustomerOrdersTabl.ProductID =
CustomerTab.CustomerProductTabl.ProductID
GROUP BY ProductDescription, Cost
HAVING SUM(OrderQuantity * Cost) > 500 OR SUM(OrderQuantity) > 100 OR ((SUM
(OrderQuantity * Cost) - COUNT(OrderID) * Cost) / SUM(OrderQuantity * Cost)) *
100 >= 30 OR SUM(OrderQuantity) = 0;
Explanation
This SQL query provides detailed analytics about products based on their sales, demand, and profit margin. It categorises products using several CASE statements and calculates various metrics to give insights into product performance.
The query uses a JOIN to combine order data with product details and applies a GROUP BY clause to aggregate results by product description and cost.
- Selected Columns and Calculations:
ProductDescription: Describes the product.Cost: The unit cost of the product.SUM(OrderQuantity * Cost) AS TotalRevenue: Calculates total revenue by multiplying order quantity by the cost.SUM(OrderQuantity) AS TotalQuantitySold: Calculates the total quantity of the product sold.((SUM(OrderQuantity * Cost) - COUNT(OrderID) * Cost) / SUM(OrderQuantity * Cost)) * 100 AS ProfitMargin: Calculates the profit margin as a percentage.CASEstatements:- SalesCategory: Categorises products as ‘High Sales’ if total revenue is over £500, otherwise ‘Low Sales’.
- DemandCategory: Categorises products as ‘High Demand’ if more than 100 units are sold, otherwise ‘Low Demand’.
- ProfitMarginCategory: Categorises products as ‘High Profit Margin’ if the profit margin is 30% or higher, otherwise ‘Low Profit Margin’.
- SoldStatus: Categorises products as ‘Not Sold’ if no units are sold, otherwise ‘Sold’.
- JOIN Operation:
JOIN CustomerTab.CustomerProductTabl ON CustomerTab.CustomerOrdersTabl.ProductID = CustomerTab.CustomerProductTabl.ProductID: This join links the orders to the corresponding product details using theProductID.
- GROUP BY Clause:
GROUP BY ProductDescription, Cost: Groups the results by product description and cost, allowing the query to calculate aggregated metrics for each product.
- Filtering with
HAVINGClause:- The
HAVINGclause filters products based on several conditions to highlight significant products:- Total revenue over £500.
- More than 100 units sold.
- Profit margin 30% or higher.
- Products that have not been sold.
- The
HR & Product Orders relationship diagram