
SQL exercises on retail shopping: Single table queries
Introduction
In this module, we will explore how to use Structured Query Language (SQL) to solve problems in real-world business scenarios. The questions and their solutions will involve querying single tables, requiring only a basic understanding of SQL commands.
We will focus on business scenarios related to human resources (HR) and product orders within a typical retail business.
Please note that the commands used in the sample solutions primarily follow Microsoft Transact-SQL (T-SQL) conventions. Please follow the instructions here to download and install SQL server 2022 Developer edition if you do not have this already on your computer.
You can download the “.bak” database file for the HR and Product Orders database here. Follow this procedure to restore the “.bak” database file on the installed SQL Server Management Studio.
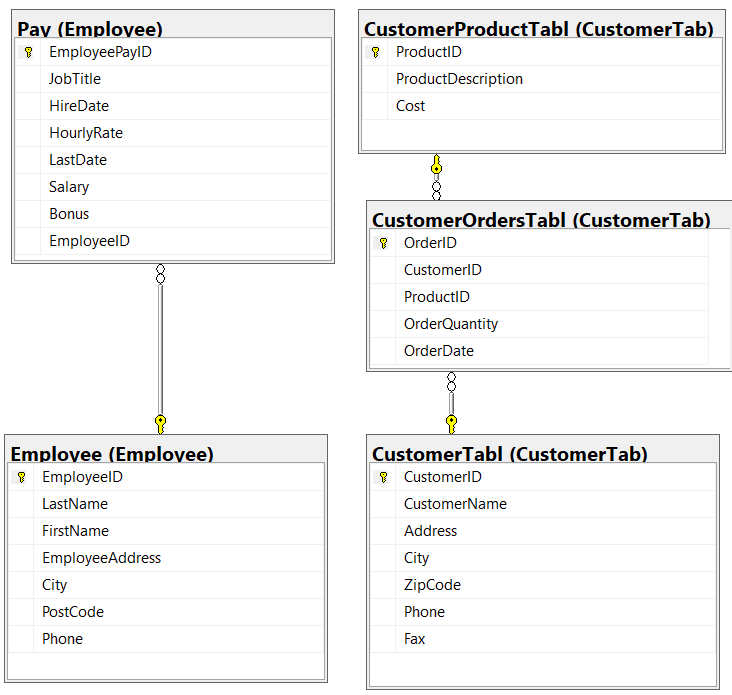
A relationship diagram for the HR and Product Orders tables is provided on the right if you are using a laptop or desktop computer. Please review this diagram to familiarise yourself with the table relationships before tackling the scenario questions.
Sample solutions to the business scenario problems are provided after each question. It is recommended to first attempt solving the problems independently before reviewing the provided solutions. Each sample solution includes an explanation of how the problem is solved.
The Select Statement
1. Product Cost Distribution Analysis
You work for a retail company that sells various products. Your manager wants to analyse the cost distribution of products in the inventory. Using the CustomerProductTabl table, retrieve the details of all products.
Sample solution
SELECT *
FROM CustomerTab.CustomerProductTabl
Explanation
This query retrieves all columns (* indicates all columns) from the CustomerProductTabl, table. The result of this query will be a dataset containing all records from the CustomerProductTabl table.
2. Product Quantity Analysis I
You are working for a company that sources products from various suppliers. Your task is to analyse the quantities of the orders made. Retrieve a list of all unique product orders. Use the CustomerOrdersTabl table.
Sample solution
SELECT
DISTINCT (ProductID)
FROM CustomerTab. CustomerOrdersTabl
Explanation
This query retrieves all unique ProductID values from the CustomerOrdersTabl table. The DISTINCT keyword ensures that only unique values are returned, eliminating any duplicate ProductID entries that may exist in the table.
3. Product Quantity Analysis II
You are working for a company that sources products from various suppliers. Your task is to analyse the quantities of the orders made. Retrieve a list of all product orders and display only their identity. Use the CustomerOrdersTabl table.
Sample solution
SELECT ALL
(ProductID)
FROM CustomerTab. CustomerOrdersTabl
Explanation
This query is straightforward and retrieves every ProductID from the CustomerOrdersTabl table, including repeated values. It is useful because a complete list of all products ordered is needed, including how many times each product has been ordered, for subsequent analysis or reporting.
The WHERE clause
4. Price Range Analysis
You work for an online marketplace that offers a wide range of products. Your task is to analyse products within specific price ranges to assist customers in finding products that match their budget. Using the CustomerProductTabl table:
a. Retrieve a list of products that are affordable for budget-conscious customers (cost under $1per product).
b. Find products that fall within a moderate price range (cost between $2 and $5 per product).
c. Identify high-end products that cater to customers looking for premium items (cost over $6 per product).
Sample solution
--a)
SELECT ProductID, ProductDescription, Cost
FROM  CustomerTab.CustomerProductTabl
WHERE Cost < 1;
--b)
SELECT ProductID, ProductDescription, Cost
FROM CustomerTab.CustomerProductTabl
WHERE Cost BETWEEN 2 AND 5;
--c)
SELECT ProductID, ProductDescription, Cost
FROM CustomerTab.CustomerProductTabl
WHERE Cost > 6;
Explanation
a. This query selects the ProductID, ProductDescription, and Cost columns from the CustomerProductTabl table. It filters the results to include only those products where the cost is less than 1.
b. This query selects the ProductID, ProductDescription, and Cost columns from the CustomerProductTabl table, filtering to include only products whose cost is between 2 and 5, inclusive.
c. This query selects the ProductID, ProductDescription, and Cost columns from the CustomerProductTabl table. It filters to include only products with a cost greater than 6.
5. Custom Product Selection
You’re tasked with selecting specific products for a custom order based on a list of desired product IDs. Using the CustomerProductTabl Table, retrieve the details of products with specific product IDs (2, 567, and 89) to fulfill a custom order.
Sample solution
SELECT ProductID, ProductDescription, Cost
FROM CustomerTab.CustomerProductTabl
WHERE ProductID IN (2, 567, 89);
Explanation
This query retrieves the ProductID, ProductDescription, and Cost columns from the CustomerProductTabl table. It filters the results to include only those products whose ProductID matches one of the specified values: 2, 567, or 89.
6. Product Search by exact Name
You’re working for an e-commerce company, and you want to find products with a specific name to assist a customer who is looking for those items. Your task is to retrieve product details for products that match the specific name provided by the customer. Using the
CustomerProductTabl table, retrieve the details of products with a specific name, such as “Instant Camera” or “Phone Stand”.
Sample solution
SELECT ProductID, ProductDescription, Cost
FROM CustomerTab.CustomerProductTabl
WHERE ProductDescription = 'Instant Camera' OR ProductDescription = 'Phone Stand';
Explanation
This query is particularly useful when looking to extract information about specific products by their descriptions. The query retrieves the ProductID, ProductDescription, and Cost columns from the CustomerProductTabl table. It filters the results to include only those products whose ProductDescription is either ‘Instant Camera’ or ‘Phone Stand’.
7. Items orders
You manage inventory for an online store and want to identify products that have been ordered by customers. Your superior already has a knowledge of 5 items of a specific product that were
ordered by customers on a certain date. But you are now tasked with retrieving the product details for the quantity of items that were ordered which in this case likely had other purchased dates using the CustomerOrdersTabl Table.
Sample solution
SELECT OrderID, CustomerID, ProductID, OrderQuantity, OrderDate
FROM CustomerTab. CustomerOrdersTabl
WHERE NOT OrderQuantity = 5;
Explanation
This query retrieves the OrderID, CustomerID, ProductID, OrderQuantity, and OrderDate columns from the CustomerOrdersTabl table. It filters the results to exclude orders where the OrderQuantity is exactly 5.
8. Product Search by Description
You’re working for an online store, and you want to assist customers in finding products that match certain descriptions. Your task is to retrieve product details for items that have a specific keyword in their product description. Using the CustomerProductTabl table, retrieve the details of products that have “Set” as part of their product description.
Sample solution
SELECT ProductID, ProductDescription, Cost
FROM CustomerTab.CustomerProductTabl
WHERE ProductDescription LIKE '%Set%';
Explanation
This query selects the ProductID, ProductDescription, and Cost columns from the CustomerProductTabl table. It filters the results to include only those products whose ProductDescription contains the word “Set” anywhere within the description.
9. Order Tracking I
You’re managing an employee database for an online retail store, and you want to identify the employees whose salary have not entered on the payroll. Using the Employee.Pay table, retrieve the JobTitle, and IDs for those whose names have not appeared on the payroll.
Sample solution
SELECT JobTitle, EmployeeID
FROM Employee.Pay
WHERE Salary IS NULL;
Explanation
This query selects the JobTitle and EmployeeID columns from the Pay table. It filters the results to include only those employees whose Salary is currently NULL, meaning their salary information is missing or has not been recorded.
10. Order Tracking II
You’re managing an employee database for an online retail store, and you want to identify only those employees whose salary have been entered on the payroll. Using the Employee.Pay table, retrieve the JobTitle, and IDs for those whose names have appeared on the payroll.
Sample solution
SELECT JobTitle, EmployeeID
FROM Employee.Pay
WHERE Salary IS NOT NULL;
Explanation
This query selects the JobTitle and EmployeeID columns from the Pay table. It filters the results to include only those employees whose Salary is not NULL, meaning their salary information is available and has been recorded.
11. Price Existence Check (using EXISTS)
You’re managing an e-commerce platform and want to determine if there are products with a specific price value in the CustomerProductTabl table. Your task is to check if there are products with a price above $6.
Sample solution
SELECT Cost
FROM CustomerTab.CustomerProductTabl
WHERE EXISTS (SELECT Cost
             FROM CustomerTab.CustomerProductTabl
WHERE Cost > 6);
Explanation
This query selects the Cost column from the CustomerProductTabl table. It uses a subquery within the EXISTS clause to check if there are any records in the same table where the Cost is greater than 6. If such records exist, the outer query will return the Cost for all rows in the CustomerProductTabl table.
12. Price Threshold Check (with ALL)
You’re managing an e-commerce platform and want to determine if all products have prices exceeding a certain threshold in the “CustomerProductTabl Table.” Your task is to check if all products have cost greater than $4.
Sample solution
SELECT *
FROM CustomerTab.CustomerProductTabl
WHERE Cost > ALL (SELECT Cost
            FROM CustomerTab.CustomerProductTabl
            WHERE Cost < 4)
Explanation
This query retrieves all columns from the CustomerProductTabl table. It filters the results to include only those rows where the Cost is greater than all the costs returned by a subquery. The subquery returns the costs of products that have a cost less than 4.
13. Price Threshold Check (with ANY)
You’re managing an e-commerce platform and want to determine if there’s at least one product with a price exceeding a certain threshold in the “Products Table.” Your task is to check if there’s any product with a price greater than $4.
Sample solution
SELECT *
FROM CustomerTab.CustomerProductTabl
WHERE 4 < ANY (SELECT Cost
              FROM CustomerTab.CustomerProductTabl);
Explanation
This is a rather broad query, where the condition is met as long as a single product in the entire table costs more than 4, regardless of the specific cost of other products. It retrieves all columns from the CustomerProductTabl table. It then uses a subquery to filter the results and returns only those rows where the number 4 is less than any of the costs found in the table. In other words, the query checks if there is at least one product in the table with a cost greater than 4. If such a product exists, it returns all rows from the table.
14. Total Income Threshold Calculation and Filtering
You’re managing employee payroll data, and you want to calculate the total income (Salary +Bonus) for all employees and filter those who have a total income exceeding a certain threshold. Your task is to calculate the total income and retrieve Employee IDs, Job Titles, and the calculated Total Incomes for employees whose total monthly income exceeds $3,000. Use the Employee.Pay table.
Sample solution
SELECT EmployeeID, JobTitle, (Salary + Bonus) AS TotalIncome
FROM Employee.Pay
WHERE (Salary + Bonus) > 3000
Explanation
This query selects the EmployeeID, JobTitle, and a calculated field (Salary + Bonus) labeled as TotalIncome from the Pay table. It filters the results to include only those employees whose combined Salary and Bonus exceed 3000.
The ORDER BY clause
15. Hourly Rate Threshold Calculation and Filtering
You’re managing employee payroll data in the, and you want to calculate a threshold value for hourly rate by multiplying it by 100 and filter employees whose calculated threshold exceeds a predefined limit. Your task is to calculate the threshold and retrieve Employee IDs, Job Titles, Hourly Rates, and the calculated Thresholds for employees whose threshold exceeds $1,500. Use the Employee.Pay table.
Sample solution
SELECT EmployeeID, JobTitle, HourlyRate, (HourlyRate * 100) AS Threshold
FROMEmployee.Pay
WHERE (HourlyRate * 100) > 1500;
Explanation
This query selects the EmployeeID, JobTitle, HourlyRate, and a calculated field (HourlyRate * 100) labeled as Threshold from the Pay table. It filters the results to include only those employees whose calculated Threshold value, based on multiplying their hourly rate by 100, exceeds 1500.
16. Price Range Product Listing
You manage an online marketplace and want to provide users with a product listing sorted by price range. Your task is to retrieve a list of products with their product descriptions and prices, sorted in ascending order of cost using the CustomerProductTabl table.
Sample solution
SELECT ProductID, ProductDescription, Cost
FROM CustomerTab.CustomerProductTabl
ORDER BY Cost ASC;
Explanation
This query selects the ProductID, ProductDescription, and Cost columns from the CustomerProductTabl table. It then orders the results by the Cost column in ascending order, meaning from the lowest cost to the highest.
17. Expensive Product Listing
Continuing with the online marketplace example, you now want to provide users with a product listing sorted by descending price order. Your task is to retrieve a list of products with their product descriptions and cost, sorted in descending order of cost using the
CustomerProductTabl table.
Sample solution
SELECT ProductID, ProductDescription, Cost
FROM CustomerTab.CustomerProductTabl
ORDER BY Cost DESC;
Explanation
This query selects the ProductID, ProductDescription, and Cost columns from the CustomerProductTabl table. It then orders the results by the Cost column in descending order, meaning from the highest cost to the lowest.
18. Low-Cost Product Listing
You want to create a list of low-cost products available in your online store. Your task is to retrieve a list of products with their descriptions and prices, sorted by ascending price. You also want to limit the list to products with cost under $6. Use the CustomerProductTabl table.
Sample solution
SELECT ProductID, ProductDescription, Cost
FROM CustomerTab.CustomerProductTabl
WHERE Cost < 6
ORDER BY Cost ASC;
Explanation
This query selects the ProductID, ProductDescription, and Cost columns from the CustomerProductTabl table. It filters the results to include only those products whose Cost is less than 6. After filtering, the results are sorted by the Cost column in ascending order, meaning from the lowest cost to the highest.
19. High-Cost Product Listing
You want to provide customers with a list of high-cost products available in your online store. Your task is to retrieve a list of products with their descriptions and prices, sorted by descending price. You also want to limit the list to products with prices above $3. Use the CustomerProductTabl table.
Sample solution
SELECT ProductID, ProductDescription, Cost
FROM CustomerTab.CustomerProductTabl
WHERE Cost > 3
ORDER BY Cost DESC;
Explanation
This query selects the ProductID, ProductDescription, and Cost columns from the CustomerProductTabl table. It filters the results to include only those products whose Cost is greater than 3. After filtering, the results are sorted by the Cost column in descending order, meaning from the highest cost to the lowest.
20. Affordable Products with Alphabetical Order
You want to create a list of affordable products available in your online store, sorted by their product descriptions in ascending alphabetical order. Your task is to retrieve a list of products
with their descriptions and costs, sorted by ascending product description. You also want to limit the list to products with prices under $5. Use the CustomerProductTabl table.
Sample solution
SELECT ProductID, ProductDescription, Cost
FROM CustomerTab.CustomerProductTabl
WHERE Cost < 5
ORDER BY ProductDescription ASC;
Explanation
This query selects the ProductID, ProductDescription, and Cost columns from the CustomerProductTabl table. It filters the results to include only those products whose Cost is less than 5. After filtering, the results are sorted alphabetically by the ProductDescription column in ascending order.
21. Affordable Products with Reverse Alphabetical Order
You want to create a list of affordable products available in your online store, sorted by their product descriptions in descending alphabetical order. Your task is to retrieve a list of products with their descriptions and prices, sorted by descending product description. You also want to limit the list to products with prices under $5. Use the CustomerProductTabl table.
Sample solution
SELECT ProductID, ProductDescription, Cost
FROM CustomerTab.CustomerProductTabl
WHERE Cost < 5
ORDER BY ProductDescription DESC;
Explanation
This query selects the ProductID, ProductDescription, and Cost columns from the CustomerProductTabl table. It filters the results to include only those products whose Cost is less than 5. After filtering, the results are sorted by the ProductDescription column in descending order, meaning the descriptions will be listed from Z to A.
22. Employee Performance Ranking
You’re managing an HR database for a company and want to generate a performance ranking report for employees. You want to order the employees first by their Job title in ascending order and then by their salary in descending order within each department. Your task is to retrieve employee details, including their IDs, Job title, and salaries, sorted according to these criteria. Use the Employee.Pay table.
Sample solution
SELECT EmployeeID, EmployeeID, JobTitle, Salary
FROM Employee.Pay
ORDER BY JobTitle ASC, Salary DESC;
Explanation
This query selects the EmployeeID, JobTitle, and Salary columns from the Pay table. The results are ordered first by the JobTitle in ascending alphabetical order and then, within each job title group, by Salary in descending order.
23. High-Salary Employees in Specific Roles
You’re managing an HR database for a company and want to generate a report on high-salary employees with specific job titles. You want to order the employees first by their roles and then by their salary within each department. Your task is to retrieve employee details, including their IDs, Job titles (specifically Salesman and Shipper), Hire date and salaries. Use the Employee.Pay table.
Sample solution
SELECT EmployeePayID, JobTitle, Hiredate, Salary
FROM Employee.Pay
WHERE JobTitle IN ('Salesman', 'Shipper')
ORDER BY JobTitle, Salary;
Explanation
This query selects the EmployeePayID, JobTitle, Hiredate, and Salary columns from the Pay table. It filters the results to include only those employees whose job title is either ‘Salesman’ or ‘Shipper’. The results are then ordered first by JobTitle and then by Salary in ascending order.
24. Balanced Product Display
You’re managing an online store’s product display and want to provide a balanced presentation of products. You want to retrieve a list of products ordered first by their description in ascending
order and then by their price in ascending order as well. Your task is to retrieve product details, including IDs, description, and prices, sorted according to these criteria. Use the CustomerProductTabl table.
Sample solution
SELECT ProductID, ProductDescription, Cost
FROM CustomerTab.CustomerProductTabl
ORDER BY 2, 3;
Explanation
This query selects the ProductID, ProductDescription, and Cost columns from the CustomerProductTabl table within the CustomerTab schema. It orders the results based on the second and third columns of the selection list, which correspond to ProductDescription and Cost, respectively.
25. Product Inventory Reorder
You’re managing inventory for an e-commerce company and want to generate a reorder list for products. You want to prioritise products first by their description in descending order and then by their unit cost in ascending order. Your task is to retrieve product details, including IDs, description, and cost, sorted according to these criteria. Use the CustomerProductTabl table.
Sample solution
SELECT ProductID, ProductDescription, Cost
FROM CustomerTab.CustomerProductTabl
Explanation
This query selects the ProductID, ProductDescription, and Cost columns from the CustomerProductTabl table. It retrieves all the records in the table without applying any filtering or sorting.
Summarising functions
(Count, Sum, Average, Min, Max)
26. Employee Payroll Analysis
You’re managing employee payroll data and need to perform various counts to analyse the dataset. Your task is to count the following:
- The total number of employees, which is equivalent to counting the EmployeeID column.
- The number of distinct job titles in the organisation.
- The total number of salaries records available in the table.
- The total number of rows in the Employee table.
Sample solution
--a)
SELECT COUNT(EmployeeID) AS Employee
FROM Employee.Pay;
--b)
SELECT COUNT (DISTINCT JobTitle)
FROM Employee.Pay;
--c)
SELECT COUNT(Salary) AS TotalSalaries
FROM Employee.Pay;
--d)
SELECT COUNT (*) AS TotalRows
FROM Employee.Pay;
Explanation
a. This query counts the number of non-null EmployeeID entries in the Pay table. The result is labeled as Employee.
b. This query counts the number of unique job titles in the Pay table.
c. This query counts the number of non-null Salary entries in the Pay table. The result is labeled as TotalSalaries.
d. This query counts the total number of rows in the Pay table. The result is labeled as TotalRows.
27. Total Salary Calculation
You’re managing employee payroll data, and you need to calculate the total sum of all salaries to understand the organisation’s payroll expenses. Your task is to calculate the sum of all salaries in the “Employee.Pay” table.
Sample solution
SELECT SUM(Salary) AS TotalSalaries
FROM Employee.Pay;
Explanation
This query calculates the total sum of all Salary values in the Pay table. The result is labeled as TotalSalaries.
28. Average Salary Calculation
You’re managing employee payroll data, and you need to calculate the average of all salaries to understand the organisation’s payroll expenses. Your task is to calculate the sum of all salaries in the “Employee.Pay” table.
Sample solution
SELECT AVG(Salary) AS TotalSalaries
FROM Employee.Pay;
Explanation
This query calculates the average (mean) of all Salary values in the Pay table. The result is labeled as TotalSalaries.
29. Salary Analysis
You’re managing employee payroll data and need to analyse the salary information for your employees. Your task is to find the following:
- The minimum salary among all employees.
- The maximum salary among all employees.
Sample Solution
--a)
SELECT MIN(Salary) AS MinimumSalary
FROM Employee.Pay;
--b)
SELECT MAX(Salary) AS MaximumSalary
FROM Employee.Pay;
Explanation
a. This query retrieves the minimum Salary value from the Pay table. The result is labeled as MinimumSalary.
b. This query retrieves the maximum Salary value from the Pay table. The result is labeled as MaximumSalary.
30. Total Compensation Calculation
You’re managing employee payroll data and you need to calculate the total compensation for each employee. Total compensation includes the sum of Salary and Bonus for each employee. Your task is to calculate the total compensation for each employee and find the average total compensation for all employees.
Sample solution
-- Calculate total compensation for each employee (Salary + Bonus)
SELECT EmployeeID, JobTitle, Salary, Bonus, (Salary + Bonus) AS TotalCompensation
FROM Employee.Pay;
-- Find the average total compensation for all employees
SELECT AVG(Salary + Bonus) AS AverageTotalCompensation
FROM Employee.Pay;
Explanation
This query selects the EmployeeID, JobTitle, Salary, and Bonus columns from the Pay table. It also calculates the total compensation for each employee by summing their Salary and Bonus, labeling the result as TotalCompensation.
The GROUP BY Clause
31. Employee City Analysis
You’re managing employee data and you want to analyse the distribution of employees across different cities. Your task is to list the unique combinations of EmployeeID and City to determine which employees are in each city. Use the Employee.Employee table.
Sample solution
SELECT EmployeeID, City
FROM Employee.Employee
GROUP BY EmployeeID, City;
Explanation
This query selects the EmployeeID and City columns from the Employee table. It groups the results by both EmployeeID and City, which is required for using the GROUP BY clause in SQL when selecting columns that are not being aggregated.
32. Employee Salary Grouping
You’re managing employee payroll data, and you want to analyse the distribution of employee salaries while also showing the total salary for each employee. Your task is to calculate the total salary for each employee and list the unique combinations of Salary and EmployeeID to understand how salaries are distributed among employees. Use the Employee.Pay table.
Sample solution
SELECT EmployeeID, SUM(Salary) AS TotalSalary
FROM Employee.Pay
GROUP BY Salary, EmployeeID;
Explanation
This query selects the EmployeeID and calculates the sum of Salary values grouped by Salary and EmployeeID from the Pay table. The result of the sum is labeled as TotalSalary.
33. Employee City Population Analysis
You’re managing employee data, and you want to analyse the population of employees in different cities. Your task is to count the number of employees in each city and list the cities along with their respective employee counts. Use the Employee.Employee table.
Sample solution
SELECT City, COUNT(*) AS EmployeeCount
FROM Employee.Employee
GROUP BY City;
Explanation
This query selects the City column from the Employee table and counts the number of employees in each city. The count of employees is labeled as EmployeeCount.
34. Employee City Population Analysis I (with
Sorting)
You’re managing employee data and you want to analyse the population of employees in different cities. Your task is to count the number of employees in each city, list the cities along with their respective employee counts, and sort the results in descending order of employee counts. Use the Employee.Employee table.
Sample solution
SELECT City, COUNT (*) AS EmployeeCount
FROM Employee.Employee
GROUP BY City
ORDER BY EmployeeCount DESC;
Explanation
This query selects the City column from the Employee table and counts the number of employees in each city. It groups the results by city and orders the cities by the count of employees in descending order, so cities with the highest number of employees appear first. The count of employees is labeled as EmployeeCount.
35. Employee City Population Analysis II
Following on from question 34, you’re managing employee data and you want to analyse the population of employees in different cities. Your task is to count the number of employees in each city, list the cities along with their respective employee counts, and sort the results by multiple columns using numbers in any sorting order.
Sample solution
SELECT City, COUNT(*) AS EmployeeCount
FROM Employee.Employee
GROUP BY CityORDER BY 1, 2;
Explanation
This query selects the City column from the Employee table and counts the number of employees in each city. It groups the results by city and orders the results first by the city name in ascending alphabetical order and then by the employee count in ascending order. The count of employees is labeled as EmployeeCount.
The HAVING Clause
36. Employee Compensation Analysis and Salary Filtering for Payroll Management
You’re managing employee payroll data table, and you want to analyse the distribution of employee total compensation while also filtering out specific groups of employees based on salary conditions. Your task is to: Calculate the total compensation (salary plus bonus) for each employee, list the unique combinations of Salary and EmployeeID to understand how salaries are distributed among employees and filter out employees whose total income is above or equal to $3000.
Sample solution
SELECT EmployeeID, SUM (Salary + Bonus) AS TotalCompensation
FROM Employee.Pay
GROUP BY EmployeeID
HAVING SUM (Salary + Bonus) <= 3000;
Explanation
This query selects the EmployeeID from the Pay table and calculates the total compensation for each employee by summing their Salary and Bonus. The results are grouped by EmployeeID, and only those employees whose total compensation is less than or equal to 3000 are included in the result set. The total compensation is labeled as TotalCompensation.
37. City-wise Employee Population Analysis and Filtering I
You’re managing employee data, and you want to analyse the population of employees in different cities. Your task is to count the number of employees in each city, list the cities along with their respective employee counts, filter out cities with more than 3 employees, and sort the results by the number of employees in descending order.
Sample solution
SELECT City, COUNT (*) AS EmployeeCount
FROM Employee.Employee
GROUP BY City
HAVING COUNT (*) <= 3
ORDER BY EmployeeCount DESC;
Explanation
This query selects the City column from the Employee table and counts the number of employees in each city. It groups the results by city and filters to include only those cities that have 3 or fewer employees. The cities are then ordered by the employee count in descending order, so cities with the highest counts (up to 3) appear first. The count of employees is labeled as EmployeeCount.
38. City-wise Employee Population Analysis and Filtering II
Following on from question 38, you’re managing employee data, and you want to analyse the population of employees in different cities. Your task is to count the number of employees in each city, list the cities along with their respective employee counts, filter out cities with more than 3 employees, and sort the results by multiple columns using numbers in any sorting order.
Sample solution
SELECT City, COUNT (*) AS EmployeeCount
FROM Employee.Employee
GROUP BY City
HAVING COUNT (*) <= 3
ORDER BY 2,1;
Explanation
This query selects the City column from the Employee table and counts the number of employees in each city. It groups the results by city and filters to include only those cities that have 3 or fewer employees. The results are then ordered first by the employee count and then by the city name. The count of employees is labeled as EmployeeCount.
The CONCAT function
39. Employee Full Name Concatenation
You’re managing employee data, and you want to create a report that displays the full names of employees by concatenating their first names and last names. Your task is to generate a list of employee IDs along with their full names. Use the Employeee.Employee table.
Sample solution
SELECT EmployeeID, CONCAT (FirstName, ' ', LastName) AS FullName
FROM Employee.Employee
Explanation
This query selects the EmployeeID and creates a full name for each employee by concatenating their FirstName and LastName with a space in between. The result is labeled as FullName. The data is retrieved from the Employee table within the Employee schema.
TRANSLATE function
40. Protecting Phone Number Privacy
You’re managing employee data in the “Employee” table, and you want to protect the privacy of phone numbers by replacing the last 4 digits of each phone number with ‘xxx’ for security reasons. Your task is to create a report that displays the phone numbers ‘xxx’ for all employees.
Sample solution
SELECT EmployeeID, LastName, FirstName,
TRANSLATE (Phone, '0123456789', 'xxxxxxxxxx') AS ProtectedPhone
FROM Employee.Employee;
Explanation
This query selects the EmployeeID, LastName, FirstName, and a modified version of the Phone column from the Employee table within the Employee schema. The TRANSLATE() function is used to replace each digit in the phone number with an ‘x’, effectively masking the phone number for privacy. The masked phone number is labeled as ProtectedPhone.
UPPER and LOWER Functions
41. Name Uppercase Conversion
You’re managing employee data, and you want to convert the last names and first names of employees to uppercase for uniformity in your reports. Your task is to create a report that displays the employee information with uppercase last names and first names.
Sample solution
SELECT EmployeeID, UPPER(LastName) AS UppercaseLastName,
UPPER(FirstName) AS UppercaseFirstName,
EmployeeAddress, City, PostCode, Phone
FROM Employee.Employee
Explanation
This query selects the EmployeeID, converts the LastName and FirstName to uppercase, and also retrieves EmployeeAddress, City, PostCode, and Phone from the Employee table. The uppercase conversions are labeled as UppercaseLastName and UppercaseFirstName for clarity.
SUBSTR(ING) Function
42. Phone Number Extraction
You’re managing employee data, and you want to extract a portion of the phone numbers for a report. Your task is to create a report that displays a substring of the phone numbers, starting from the 6th character, with a length of 4 characters. Use the Employee.Employee table.
Sample solution
SELECT EmployeeID, LastName, FirstName,
SUBSTRING (Phone, 6, 4) AS ExtractedPhoneSubstring
FROM Employee.Employee;
Explanation
This query selects the EmployeeID, LastName, FirstName, and a specific substring of the Phone number from the Employee table. The query extracts a portion of the phone number starting at the 6th character and continuing for 4 characters. This extracted substring is labeled as ExtractedPhoneSubstring.
LTRIM and RTRIM Functions
43. Address Cleanup
You’re managing employee data, and you’ve noticed that some addresses have leading or trailing spaces that need to be removed for consistency. Your task is to create a report that displays employee information with cleaned and trimmed employee addresses.
Sample solution
SELECT EmployeeID, LastName, FirstName, LTRIM(RTRIM(EmployeeAddress)) AS CleanedAddress,City,
PostCode, Phone
FROM Employee.Employee;
Explanation
This query selects the EmployeeID, LastName, FirstName, City, PostCode, and Phone columns from the Employee table. It also cleans up the EmployeeAddress by removing any leading and trailing spaces, using the LTRIM() and RTRIM() functions, and labels the cleaned address as CleanedAddress.
LENGTH function
44. Name Length Calculation
You’re managing employee data, and you need to determine the length of both the last names and first names of employees for reporting purposes. Your task is to create a report that displays the employee IDs along with the lengths of their last names and first names. Use Employee.Employee table.
Sample solution
SELECT EmployeeID, LEN(LastName) AS LastNameLength,
LEN(FirstName) AS FirstNameLength
FROM Employee.Employee;
Explanation
This query selects the EmployeeID from the Employee table and calculates the length of the LastName and FirstName for each employee. The lengths of the last and first names are labeled as LastNameLength and FirstNameLength, respectively.
The COALESCE Function
45. Employee Compensation Calculation
You’re managing employee compensation data which includes information about hourly pay, salary, and bonuses. Your task is to create a report that calculates the total compensation for each employee, considering all possible compensation components, and handle NULL values gracefully. Use the Employee.Pay table.
Sample solution
SELECT EmployeeID, JobTitle, HireDate,
COALESCE (HourlyRate, 0) + COALESCE (Salary, 0) + COALESCE(Bonus, 0) AS
TotalCompensation
FROM Employee.Pay;
Explanation
This query selects the EmployeeID, JobTitle, and HireDate from the Pay table. It calculates the TotalCompensation for each employee by summing the HourlyRate, Salary, and Bonus fields. The COALESCE() function is used to replace any NULL values in these fields with 0 to ensure accurate calculations.
REPLICATE Function
46. Phone Number Formatting
You’re managing employee data, and you need to format the “Phone” column to ensure that all phone numbers have a consistent length of 15 characters by adding trailing spaces where needed. This is essential for data consistency and reporting purposes. Use the Employee.Employee table.
Sample solution
SELECT EmployeeID, LastName, FirstName,
EmployeeAddress, City, PostCode,
RIGHT(Phone + REPLICATE('-', 15), 15) AS FormattedPhone
FROM Employee.Employee;
Explanation
This query selects the EmployeeID, LastName, FirstName, EmployeeAddress, City, and PostCode from the Employee table. It also formats the Phone number to ensure it has a fixed length of 15 characters by padding with hyphens (-) if necessary. The formatted phone number is labeled as FormattedPhone.
47. Product Description Formatting
You’re managing product data in the “Product” table, and you need to format the “ProductDescription” column to ensure that all product descriptions have a consistent length by adding dots or periods at the end. This is useful for creating a uniform display of product descriptions. Use the CustomerProductTabl table.
Sample solution
SELECT ProductID, LEFT(REPLICATE('.', 30) + ProductDescription, 30) AS
FormattedProductDescription, Cost
FROM CustomerTab.CustomerProductTabl;
Explanation
This query selects the ProductID, a formatted version of the ProductDescription, and Cost from the CustomerProductTabl table. The ProductDescription is formatted to ensure it is 30 characters long, using dots (.) for padding if necessary. The formatted product description is labeled as FormattedProductDescription.
Conversion Functions (CAST AND CONVERT)
48. Price Conversion
You’re managing product data, and the “Cost” column is currently stored as strings or money. You need to convert the “Cost” column to a numeric data type (e.g., DECIMAL or FLOAT) to perform accurate calculations and comparisons based on cost. Your goal is to convert the prices for all products. Use the CustomerProductTabl table.
Sample solution
SELECT ProductID, ProductDescription,
CAST (Cost AS DECIMAL (10, 2)) AS ConvertedPrice
FROM CustomerTab.CustomerProductTabl;
Explanation
This query selects the ProductID and ProductDescription columns from the CustomerProductTabl table. It converts the Cost column into a decimal number with two decimal places, providing a more precise representation of the product price. The converted cost is labeled as ConvertedPrice.
CONCAT AND SUBSTRING
49. Employee Data Transformation for Reporting
You’re managing employee data, and you need to perform data transformations on the names and phone numbers for reporting purposes. Specifically, you want to: Create a new column called “FullName” that concatenates the “FirstName” and “LastName” columns with a space in between. Format the “Phone” column to separate the numbers with dashes (e.g., “555-555-1234”). Use the Employee.Employee table.
Sample solution
SELECT EmployeeID, CONCAT (FirstName, ' ', LastName) AS FullName, CONCAT (SUBSTRING (Phone, 1, 3), '-', SUBSTRING (Phone, 4, 3), '-', SUBSTRING (Phone, 7, 4)) AS FormattedPhone
FROM Employee.Employee;
Explanation
This query selects the EmployeeID from the Employee table. It constructs a full name for each employee by concatenating their FirstName and LastName with a space in between, and formats the Phone number into a standard format (XXX-XXX-XXXX). The full name is labeled as FullName, and the formatted phone number is labeled as FormattedPhone.
DATE Functions
(With CASE-WHEN-THEN-ELSE conditions)
50. Years of Service Calculation
You’re managing employee data, and you need to calculate the years of service for each employee based on their “HireDate” and “LastDate.” You want to identify employees who have worked for the company for a certain number of years. Use the Employee.Pay table. Calculate the years of service for each employee based and Identify employees who have worked for the company for at least 7 years.
Sample solution
SELECT EmployeeID,
JobTitle,
HireDate,
LastDate,
DATEDIFF (YEAR, HireDate, LastDate) AS YearsOfService
FROM Employee.Pay
WHERE DATEDIFF (YEAR, HireDate, LastDate) >= 7AND
YEAR(HireDate) BETWEEN 2001 AND 2009
AND YEAR(LastDate) BETWEEN 2011 AND 2012.
Explanation
This query selects the EmployeeID, JobTitle, HireDate, and LastDate from the Pay table. It calculates the number of years of service each employee has, using the difference between HireDate and LastDate. The calculation is labeled as YearsOfService. The query then filters the results to include only those employees who have at least 7 years of service and were hired between the years 2001 and 2009, with a last working date between 2011 and 2012.
51. Employee Salary Projection
You’re managing employee data, and you need to project the potential future salaries of employees based on their current salary, bonus, and a salary increase rate. Employees are eligible for a salary increase if they have been with the company for at least 2 years and their Last Date is between 2011 and 2012. The salary increase rate is 5%.
Sample solution
SELECT EmployeeID,
JobTitle,
HireDate,
LastDate,
Salary AS CurrentSalary,Bonus,
CASE
WHEN DATEDIFF (YEAR, HireDate, GETDATE ()) >= 2AND
YEAR(LastDate) BETWEEN 2011 AND 2012 THEN
Salary * 1.05 -- Apply 5% salary increase.
ELSE Salary -- No salary increases.
END AS FutureSalary
FROM Employee.Pay
Explanation
This query selects the EmployeeID, JobTitle, HireDate, LastDate, Salary (labeled as CurrentSalary), and Bonus from the Pay table. It calculates a FutureSalary based on certain conditions: if an employee has been employed for at least 2 years and their last working date is between 2011 and 2012, they receive a 5% salary increase. Otherwise, their salary remains unchanged.
52. Performance Bonus Calculation
You manage employee data, and you need to calculate performance bonuses for employees based on their job titles and salary. Employees with the job title “Manager” are eligible for a 10% bonus on their current salary, while other employees receive a 5% bonus on their salary. However, the bonus should only be calculated for employees whose last date is between 2011 and 2012.
Sample solution
SELECT EmployeeID,
JobTitle,
Salary AS CurrentSalary, Bonus AS CurrentBonus,
CASE
WHEN JobTitle = 'Manager' THEN Salary * 0.10
ELSE Salary * 0.05
END AS PerformanceBonus
FROM Employee.Pay
WHERE YEAR(LastDate) BETWEEN 2011 AND 2012
Explanation
This query selects the EmployeeID, JobTitle, Salary (labeled as CurrentSalary), and Bonus (labeled as CurrentBonus) from the Pay table. It calculates a PerformanceBonus based on the employee’s job title: Managers receive a 10% bonus of their salary, while other employees receive a 5% bonus. The query filters the results to include only those employees whose LastDate is between the years 2011 and 2012.
53. Performance Bonus Calculation
Still following on from the previous question, you manage employee data and need to calculate bonuses for employees based on their job titles, salary, and the current month. Employees with the job title “Manager” receive a 10% bonus on their current salary if the current month is January. For other employees, if the current month is July, they receive a 7% bonus on their salary. Otherwise, employees receive a standard 5% bonus on their salary.
Sample solution
SELECT EmployeeID,
JobTitle,
Salary AS CurrentSalary,
Bonus AS CurrentBonus,
Salary *
(CASE
WHEN MONTH (GETDATE ()) = 1 AND JobTitle = 'Manager' THEN 0.10
WHEN MONTH (GETDATE ()) = 7 AND JobTitle <> 'Manager' THEN 0.07
ELSE 0.05
END) AS PerformanceBonus
FROM Employee.Pay
Explanation
This query selects the EmployeeID, JobTitle, Salary (labeled as CurrentSalary), and Bonus (labeled as CurrentBonus) from the Pay table. It calculates a PerformanceBonus based on the current month and the employee’s job title:
- Managers receive a 10% bonus if the current month is January.
- Non-managers receive a 7% bonus if the current month is July.
- In all other cases, a 5% bonus is applied.
54. Employee Salary Adjustment
You manage employee data, and you need to calculate and update salaries for employees based on their job titles and years of service. Employees with the job title “Salesman” are eligible for a 10% salary increase if they have been with the company for more than 5 years. Employees with the job title “Shipper” receive a 5% salary increase if they have been with the company for more than 3 years. For all other employees, no salary adjustment is made.
Sample solution
SELECT EmployeeID,
JobTitle,
HireDate,
Salary AS OriginalSalary,
CASE
WHEN JobTitle = 'Salesman' AND DATEDIFF (YEAR, HireDate, GETDATE ()) > 5 THEN
Salary * 1.10
WHEN JobTitle = 'Shipper' AND DATEDIFF (YEAR, HireDate, GETDATE ()) > 3 THEN Salary
* 1.05
ELSE Salary
END AS AdjustedSalary
FROM Employee.Pay
Explanation
This query selects the EmployeeID, JobTitle, HireDate, and Salary (labeled as OriginalSalary) from the Pay table. It calculates an AdjustedSalary based on the employee’s job title and their length of service:
- Salesmen who have been employed for more than 5 years receive a 10% salary increase.
- Shippers who have been employed for more than 3 years receive a 5% salary increase.
- All other employees have their salaries remain unchanged.
55. Overtime Pay Calculation
You manage employee data, and you need to calculate overtime pay for employees who have worked more than 40 hours a week. Employees are paid their hourly rate for the first 40 hours and 1.5 times their hourly rate for any additional hours worked beyond 40 hours in a week. Calculate and update the “Salary” column for employees to include overtime pay based on their weekly hours worked.
Sample solution
SELECT EmployeeID,
JobTitle,
HireDate,
HourlyRate,
LastDate,
CASE
WHEN HourlyRate IS NOT NULL AND DATEDIFF (WEEK, HireDate, GETDATE ()) > 0 THEN
(40 * HourlyRate) + ((CASE WHEN HourlyRate > 0 THEN (HourlyRate * 1.5) ELSE 0 END)
* (DATEDIFF (WEEK, HireDate, GETDATE ()) - 1) * 40)
ELSE
Salary
END AS CalculatedSalary
FROM Employee.Pay;
Explanation
This query selects the EmployeeID, JobTitle, HireDate, HourlyRate, and LastDate from the Pay table. It calculates a CalculatedSalary based on hourly rate and weeks worked. If an employee is paid hourly and has been employed for more than one week, their salary is calculated using both regular and overtime rates. Otherwise, the regular salary is used.
56. Vacation Days Calculation
In your organisation, employees accrue vacation days based on their years of service. Employees with less than 5 years of service receive 10 vacation days per year, and employees with 5 or more years of service receive 15 vacation days per year. Calculate and display the number of vacation days accrued by each employee based on their years of service assuming they are still in employment up till today’s date. Employees with less than 5 years of service receive 10 vacation days per year, and employees with 5 or more years of service receive 15 vacation days per year. Use the Employee.Pay table.
Sample solution
SELECT EmployeeID,
JobTitle,
HireDate,
DATEDIFF(YEAR, HireDate, GETDATE()) AS YearsOfService,
CASE
WHEN DATEDIFF(YEAR, HireDate, GETDATE()) < 5 THEN 10
ELSE 15
END AS VacationDaysAccrued
FROM Employee.Pay
Explanation
This query selects the EmployeeID, JobTitle, and HireDate from the Pay table. It calculates the number of YearsOfService for each employee based on their hire date. Depending on the number of years of service, it determines the number of VacationDaysAccrued:
- Employees with less than 5 years of service accrue 10 vacation days.
- Employees with 5 or more years of service accrue 15 vacation days.
57. Retirement Eligibility Calculation
In your organisation, employees are eligible for retirement after they reach a certain number of years of service. You need to determine which employees are eligible for retirement based on their hire dates. Identify and display the employees who are eligible for retirement based on reaching service years of 20 years or more.
Sample solution
SELECT EmployeeID,
JobTitle,
HireDate,
DATEDIFF (YEAR, HireDate, GETDATE ()) AS YearsOfService,
CASE
WHEN DATEDIFF (YEAR, HireDate, GETDATE ()) >= 20 THEN 'Eligible for
Retirement'
ELSE 'Not Eligible for Retirement'
END AS RetirementStatus
FROM Employee.Pay
Explanation
This query selects the EmployeeID, JobTitle, and HireDate from the Pay table. It calculates the number of YearsOfService for each employee based on their hire date. Depending on the number of years of service, it assigns a RetirementStatus:
- Employees with 20 or more years of service are marked as ‘Eligible for Retirement’.
- Employees with less than 20 years of service are marked as ‘Not Eligible for Retirement’.
58. Date Conversion for Reporting
In your organisation, you need to generate a report that includes the employee’s hire date and last working date in a specific date format for reporting purposes. The required date format is “YYYY-MM-DD. Use the Employee.Pay table.
Sample solution
SELECT EmployeeID,
JobTitle,
CONVERT (NVARCHAR (10), HireDate, 120) AS HireDateFormatted,
CONVERT (NVARCHAR (10), LastDate, 120) AS LastDateFormatted
FROM Employee.Pay
Explanation
This query selects the EmployeeID and JobTitle from the Pay table. It converts the HireDate and LastDate columns into a specific string format (yyyy-mm-dd) and labels them as HireDateFormatted and LastDateFormatted, respectively. The CONVERT() function is used for this formatting.
59. Employee Anniversary Recognition
In your organisation, you want to generate a report to recognise employees’ work anniversaries. The report should include the employee’s job title and a message congratulating them on their work anniversary. The message should specify the number of years they have been with the company. Use the Employee.Pay table.
Sample solution
SELECT JobTitle,
CONCAT ('Congratulations, "', JobTitle, '", on your ', DATEDIFF (YEAR,
HireDate, GETDATE ()), '-year work anniversary with our company!') AS
AnniversaryMessage
FROM Employee.Pay
Explanation
This query selects the JobTitle from the Pay table. It generates a personalised work anniversary message for each employee by concatenating their job title and the number of years they have been with the company. The message is labeled as AnniversaryMessage.
HR & Product Orders relationship diagram


One response
[…] Query Language (SQL) problems in real-world business scenarios using single table queries in a previous post which can be accessed […]