How to analyse warehouse stock trends with Python
Efficient warehouse management is essential for maintaining a smooth supply chain and ensuring customer satisfaction.
A well-organised warehouse not only reduces operational costs but also enhances the ability to meet customer demand promptly.
In this project, we will carry out a comprehensive analysis of warehouse stock trends, utilising Python programming to provide insights into product categories, supplier relationships, warehouse utilisation, and overall stock management.
If interested, please refer to this link to see how the raw warehouse dataset was first cleaned using Python.
The dataset for this analysis can be downloaded from GitHub using this link. The Python code for the analysis can be downloaded here.
Overview of the dataset
Before diving into the analysis, it’s important to understand the basic structure of the dataset.
The dataset is composed of 1000 rows or records of inventory items and 10 columns
The columns are as follows:
- Product ID: A unique identifier for each product.
- Product Name: The name of the product.
- Category: The category to which the product belongs.
- Warehouse and Location: Specifies the warehouse and aisle where the product is stored.
- Quantity: The number of units available in the warehouse.
- Price: The price per unit of the product.
- Supplier: The supplier providing the product.
- Status: Indicates if the product is currently in stock or out of stock.
- Last Restocked: The date and time when the product was last restocked.
Exploratory Data Analysis (EDA)
An Exploratory Data Analysis (EDA) will help to uncover patterns, detect anomalies, and gain insights from the data.
Using the warehouse dataset, the EDA involved creating visualisations to better understand the distribution of products, price ranges, stock status, and the relationship between quantity and price.
In addition, the frequency of restocking events by different suppliers was examined to identify potential trends or inconsistencies in the supply chain.
EDA Insights:
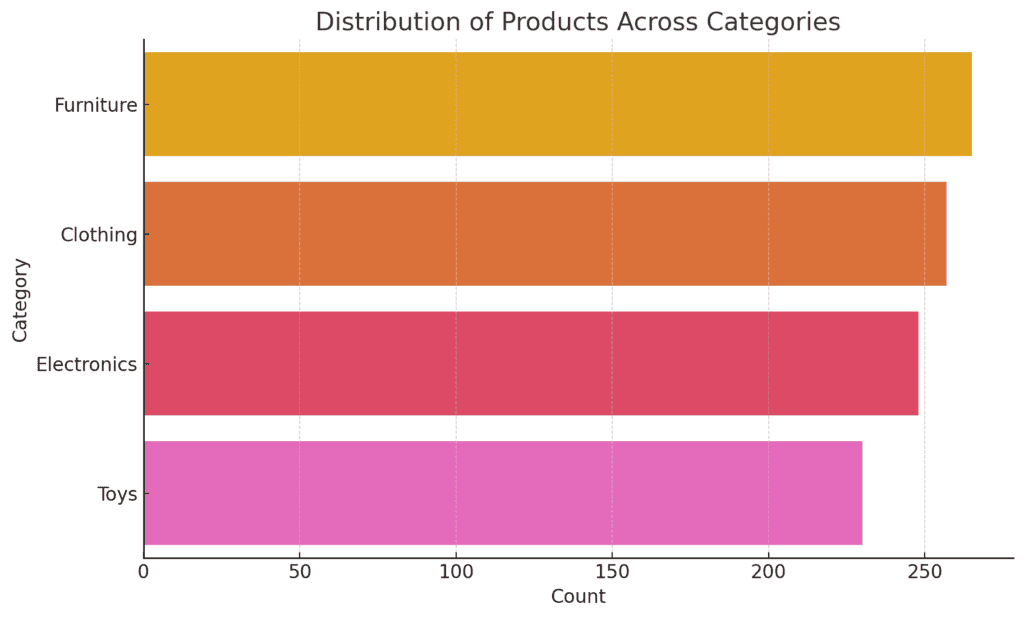
- Distribution of Products Across Categories:
- There seems to be a slight variation in the number of products across categories as illustrated below. The furniture category has the heaviest stock, indicating their popularity or demand, while the Toys category has the lowest or fewer products.
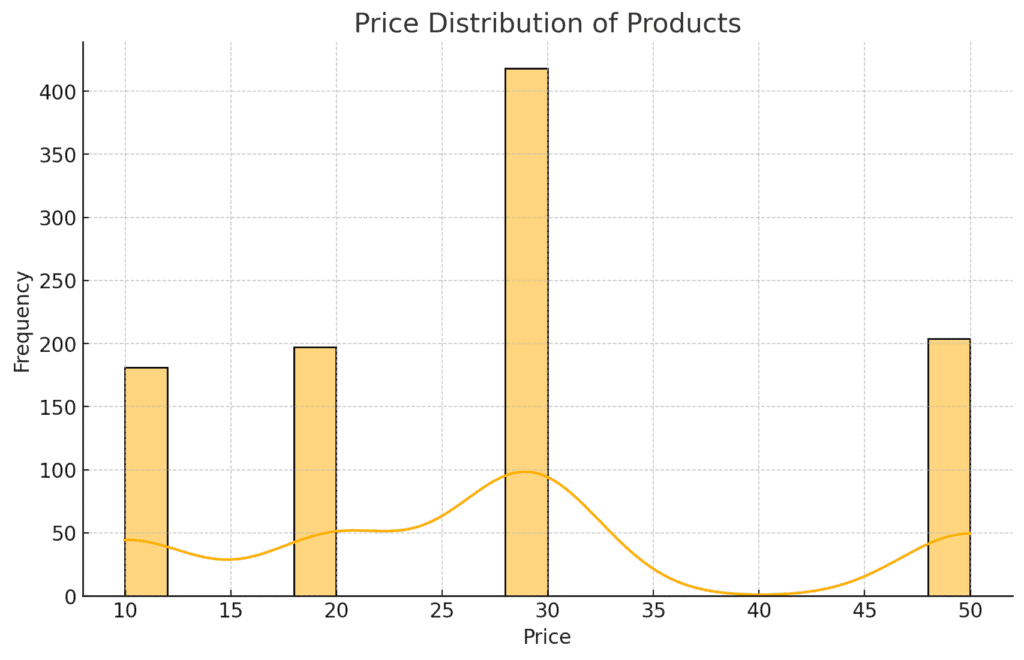
2. Price Distribution:
- The prices of products are distributed within a specific range, primarily clustering around the average price of $28 as can be observed below. This suggests a standard pricing strategy with few high-priced items.
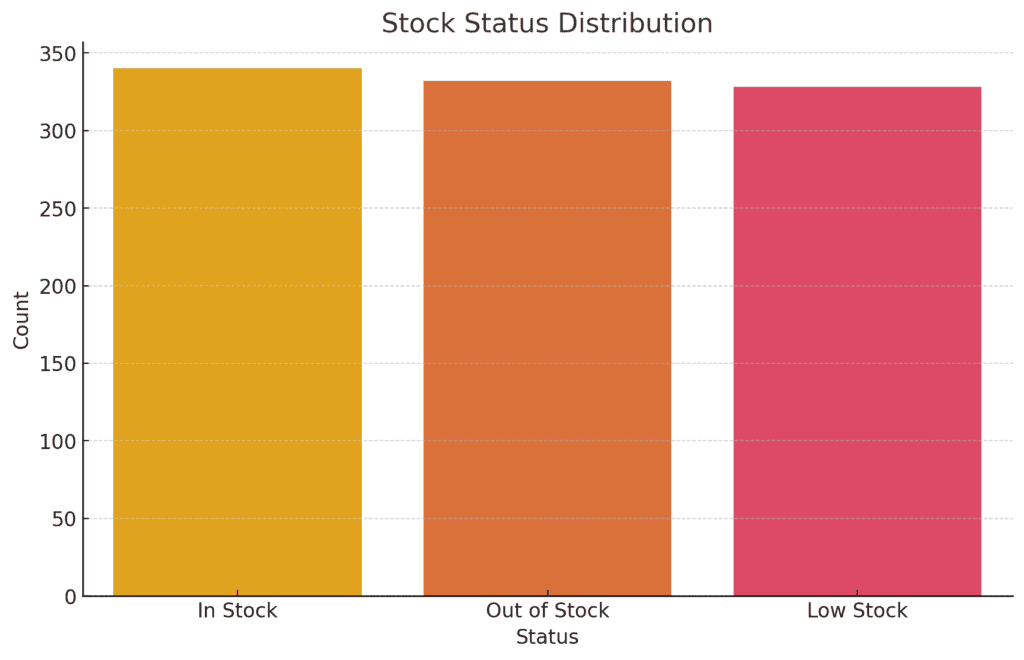
3. Stock Status Distribution:
- A slight majority of products seem to be in stock, but a significant portion is out of stock, which could indicate supply chain issues or high demand.
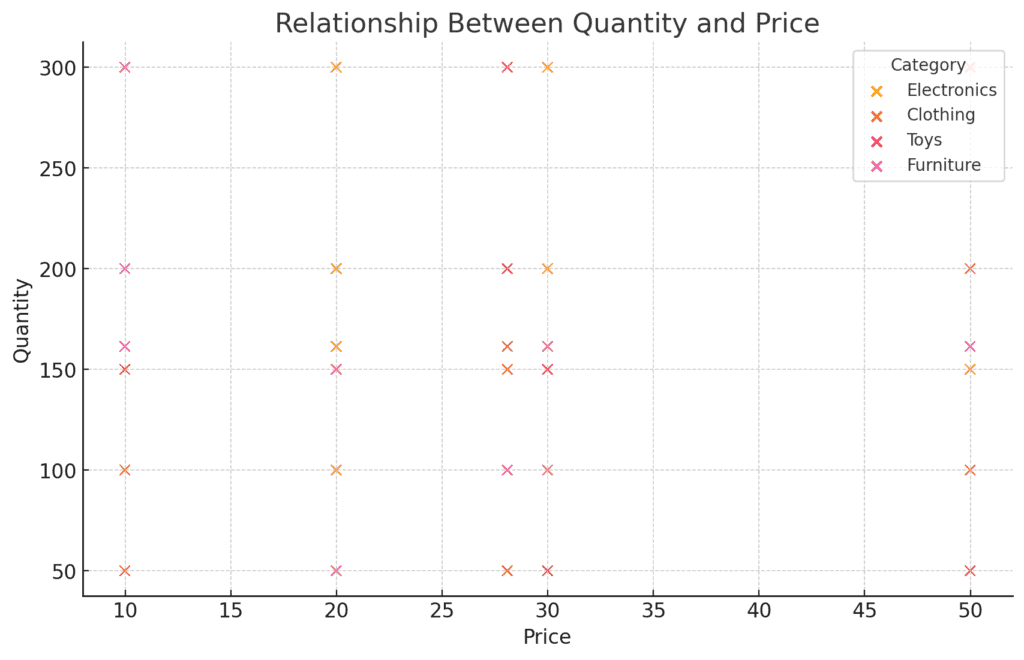
4. Relationship Between Quantity and Price:
- There seems to be no clear relationship between price and quantity as seen below, indicating that the stocking strategy might not be directly influenced by price but rather by other factors such as demand or supplier constraints.
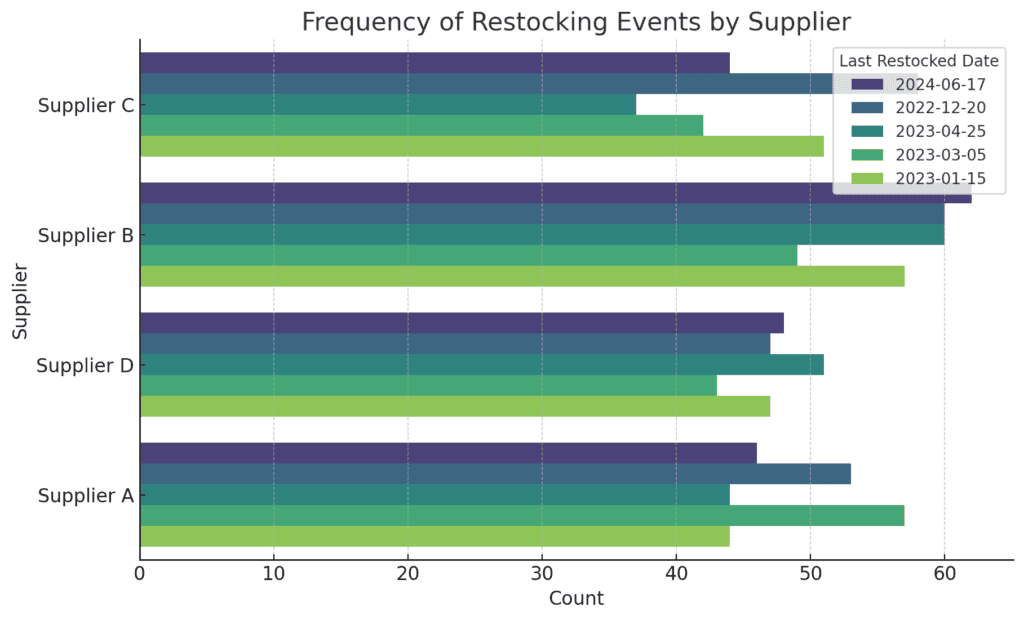
- Frequency of Restocking Events by Supplier:
- The frequency of restocking varies by supplier. All the suppliers seem to be having multiple restocking events which suggests a more frequent supply chain connection or higher demand for their products.
Detailed analysis of the warehouse data
A. Stock Analysis
Stock analysis focused on understanding the availability of products across different categories, identifying frequently out-of-stock products, and analysing restocking patterns.
We identified categories with higher average stock levels, highlighted products that were frequently out of stock, and examined the restocking frequency of various suppliers.
Stock Analysis Insights:
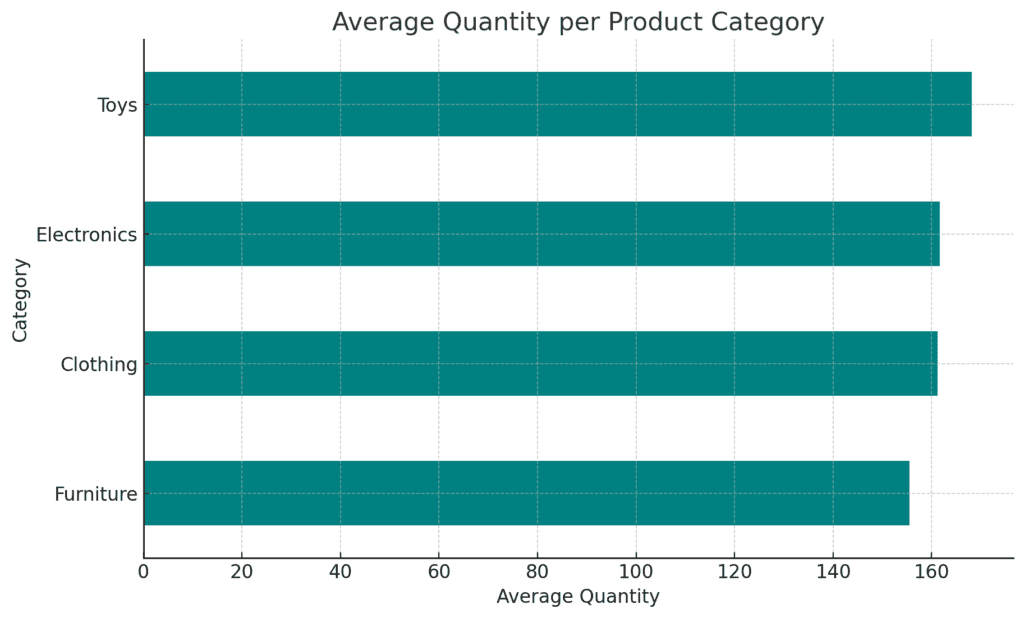
- Average Quantity per Product Category:
- The average quantity per category varies only slightly. The Furniture category has the lowest average quantities, potentially indicating less demand or higher turnover.
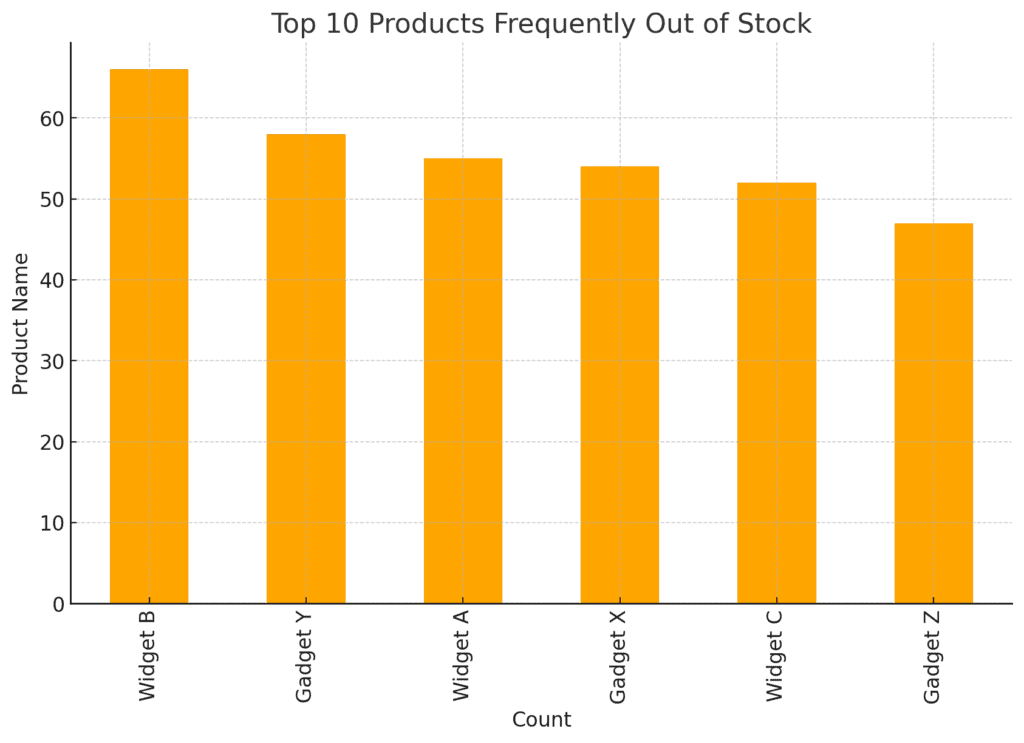
2. Products Frequently Out of Stock:
- The analysis shows that certain products (especially Widget B) are more frequently out of stock. This could indicate high demand, supply chain issues, or insufficient stock management. These products may require closer monitoring to avoid stockouts.
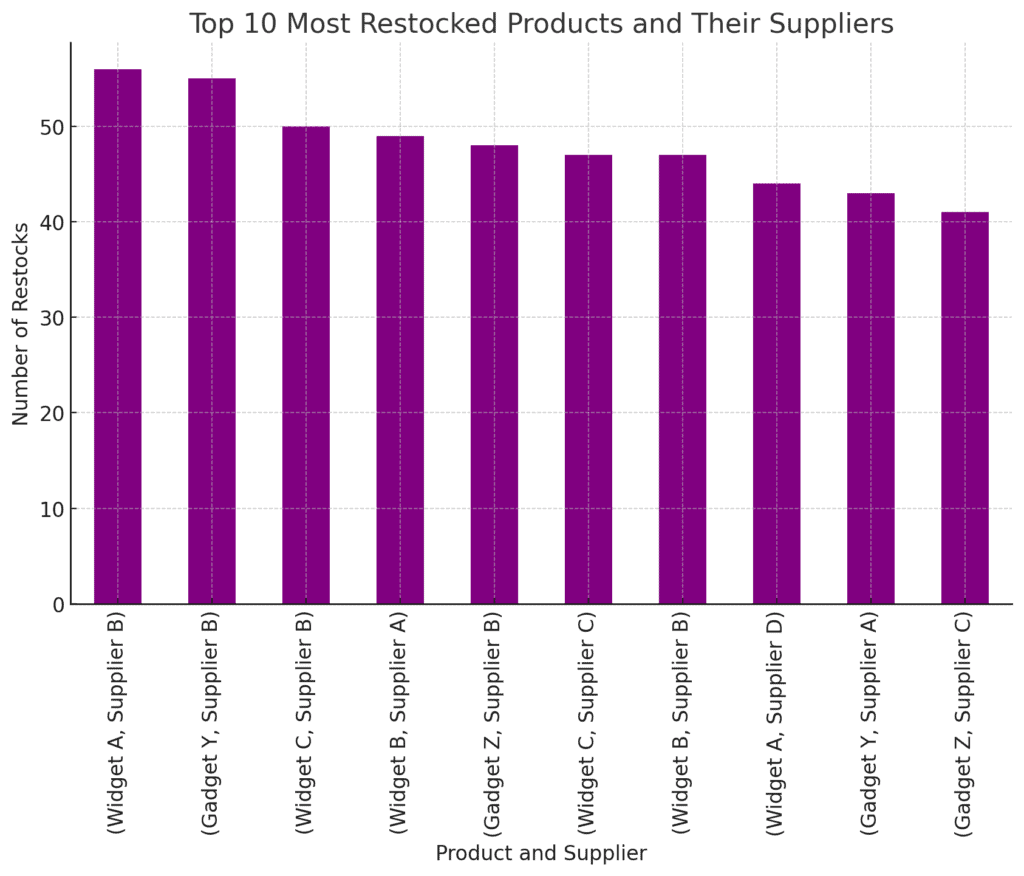
3. Most Restocked Products and Their Suppliers:
- Certain products like Widget B and Gadjet Y both associated with Supplier B seem to be restocked more frequently. This could suggest a strong relationship between these products and their supplier, potentially due to higher demand or faster turnover rates.
B. Supplier Analysis
Understanding the role of suppliers is vital for optimising stock levels and ensuring a reliable supply chain.
The analysis revealed the number of products provided by each supplier, highlighted suppliers with frequent restocking events, and analysed the dependency on specific suppliers.
These insights are essential for managing supplier relationships and ensuring that stock levels are maintained efficiently.
Supplier Analysis Insights:
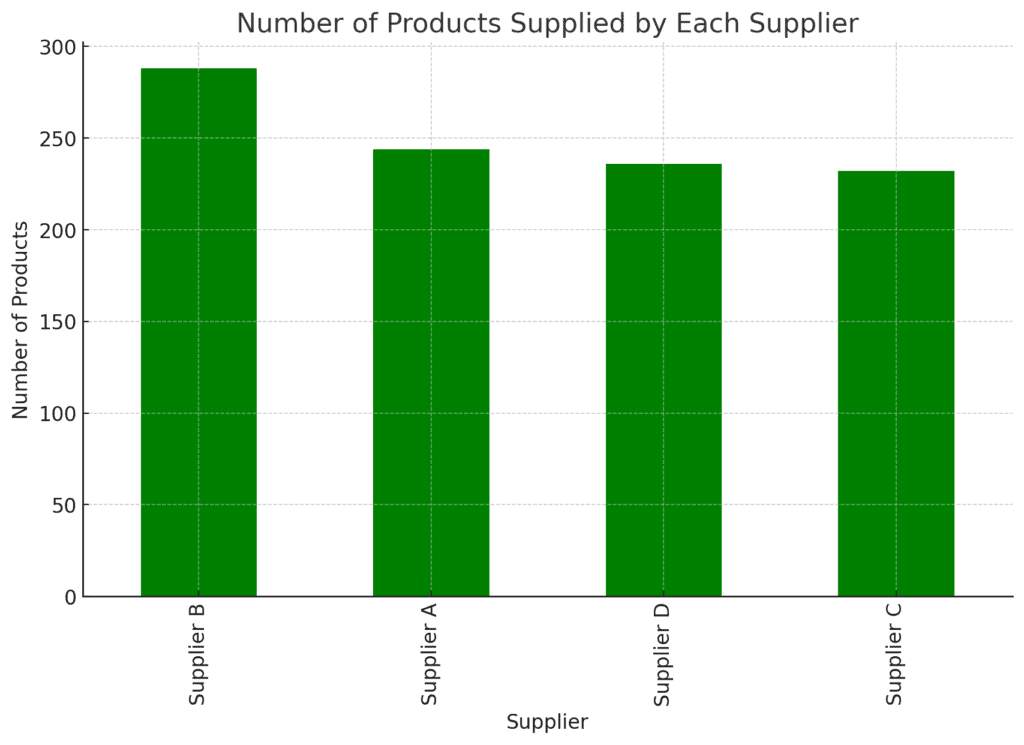
- Number of Products Supplied by Each Supplier:
- The distribution of products supplied by different suppliers is only slightly uneven, with supplier B providing significantly more products.
This could indicate a reliance on Supplier B, which may impact supply chain resilience.
- The distribution of products supplied by different suppliers is only slightly uneven, with supplier B providing significantly more products.
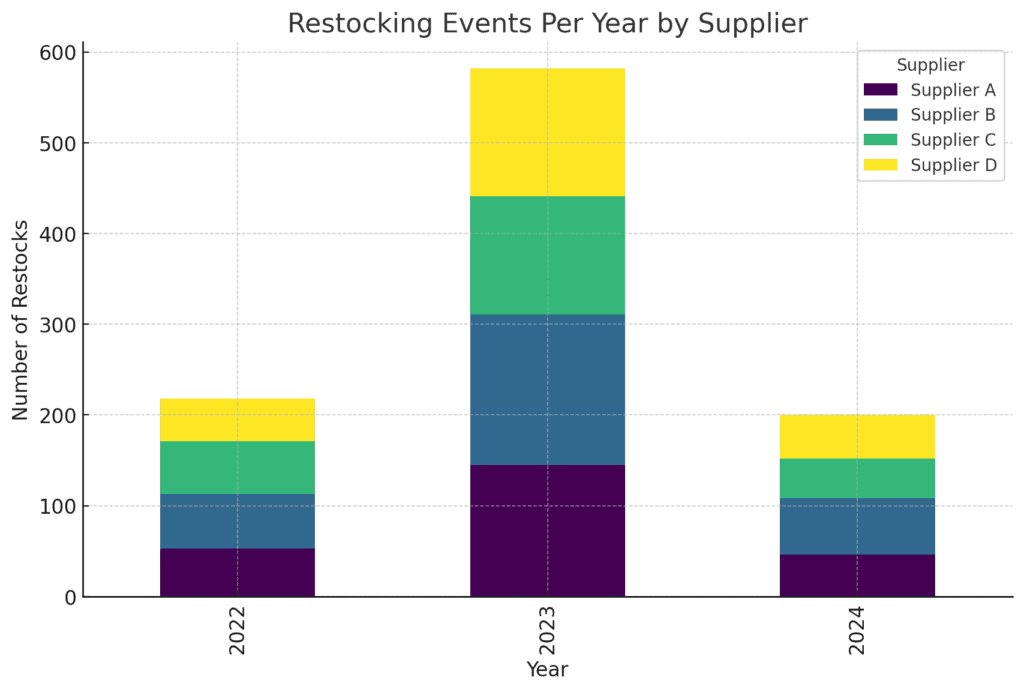
2. Average Restock Time per Supplier:
- The analysis of restocking events over time by year shows that suppliers consistently restock more frequently in the year 2023 with the number of restocks nearing 600 for the same year.
This could be due to higher demand for their products or a more efficient supply chain relationship in 2023.
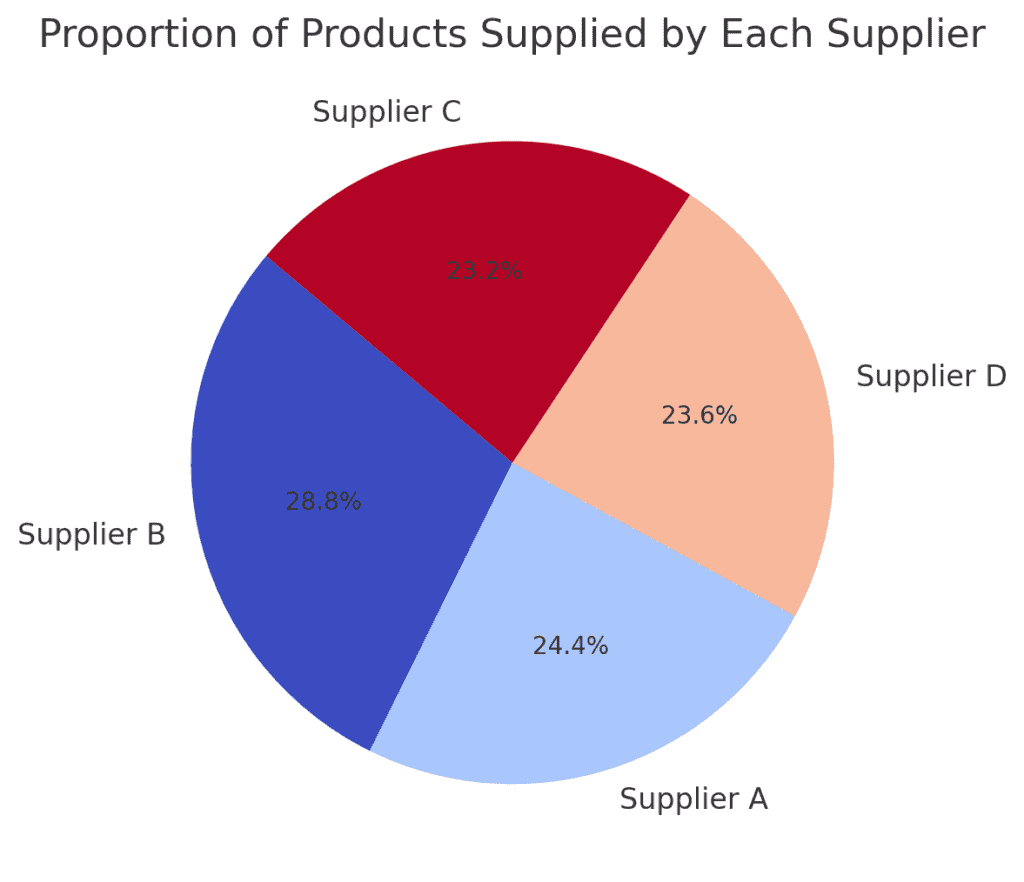
3. Dependency on Specific Suppliers:
- The pie chart illustrates the proportion of products supplied by each supplier.
A significant dependency on a Supplier B is evident, with the proportion of products supplied by them being approximately 29%. This might pose a risk if any of these suppliers’ face disruptions.
C. Stock Trends Analysis
The analysis of stock trends over time, broken down by categories, suppliers, and warehouses, provided a comprehensive view of how stock levels fluctuate.
These trends are vital for making informed decisions about inventory management, restocking schedules, and optimising warehouse operations.
By comparing stock trends across different dimensions, businesses can identify patterns and address issues proactively.
Trends in Stock Levels Over Time:
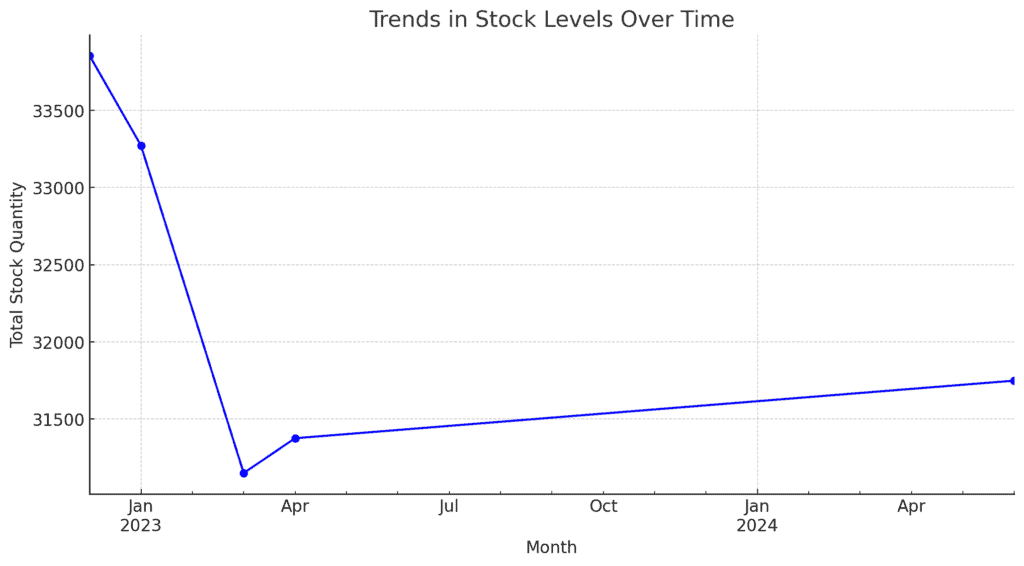
The line chart illustrates the overall trend in stock levels over time, aggregated by month. Here’s what can be observed:
- Fluctuations in Stock Levels: There are visible fluctuations in the stock levels, with January of 2023 being the period that has the highest restocking activity followed by consumption or sales.
- Stock Management Insight: Understanding these trends can aid in optimising restocking schedules and ensuring that stock levels are maintained more consistently throughout the year, preventing stockouts or overstock situations.
Trends in Stock Levels Over Time by Category:
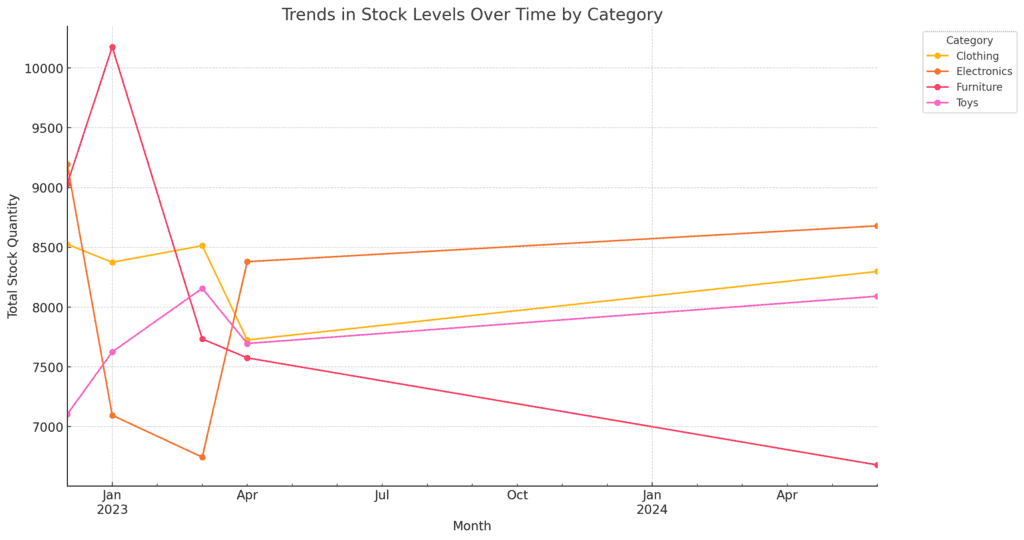
The line chart shows the stock trends for different categories over time. Key observations include:
- Category-Specific Fluctuations:
- Each category has distinct trends, with some showing more stability in stock levels, while others experience significant fluctuations.
- Each category has distinct trends, with some showing more stability in stock levels, while others experience significant fluctuations.
- Toys and Clothing:
- These categories seem to have more consistent restocking patterns, though they also exhibit noticeable peaks and troughs at certain times.
- These categories seem to have more consistent restocking patterns, though they also exhibit noticeable peaks and troughs at certain times.
- Electronics and Furniture:
- These categories show more pronounced variability, with distinct peaks and dips possibly reflecting seasonality or varying demand.
- These categories show more pronounced variability, with distinct peaks and dips possibly reflecting seasonality or varying demand.
D. Warehouse utilisation
Warehouse utilisation was analysed by examining stock trends across different warehouses. This analysis provided insights into how each warehouse contributes to overall stock management, highlighting periods of high activity and identifying potential areas for optimisation.
Trends in Stock Levels Over Time by Warehouse:
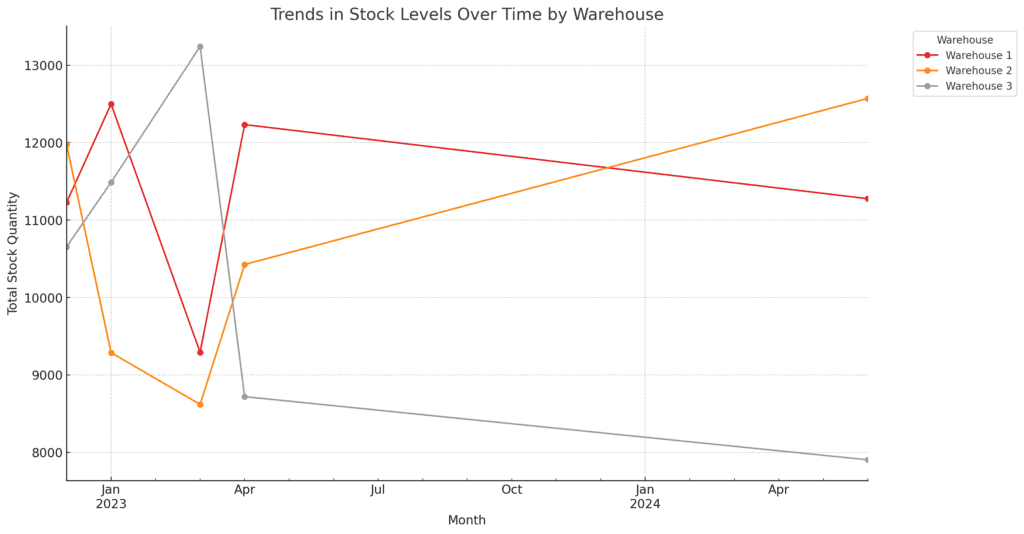
The line chart illustrates stock trends across different warehouses over time. Here are the key observations:
- Warehouse 2:
- Warehouse 2 appears to maintain relatively stable stock levels, though it has experienced fluctuations that might correspond to specific restocking events or high-demand periods.
- Warehouse 1:
- This warehouse shows more variability in stock levels, with some noticeable peaks and troughs, indicating periods of increased activity or demand.
- Warehouse 3:
- Warehouse 3 seems to have the most dynamic stock levels, with significant fluctuations.
This could suggest that it handles products with higher demand variability or that it serves as a secondary or overflow warehouse.
- Warehouse 3 seems to have the most dynamic stock levels, with significant fluctuations.
- Comparison:
- The comparison shows that each warehouse has its own unique trend, likely influenced by the types of products stored, the role of the warehouse in the overall logistics network, and possibly regional demand differences.
Trends in Stock Levels Over Time by Supplier
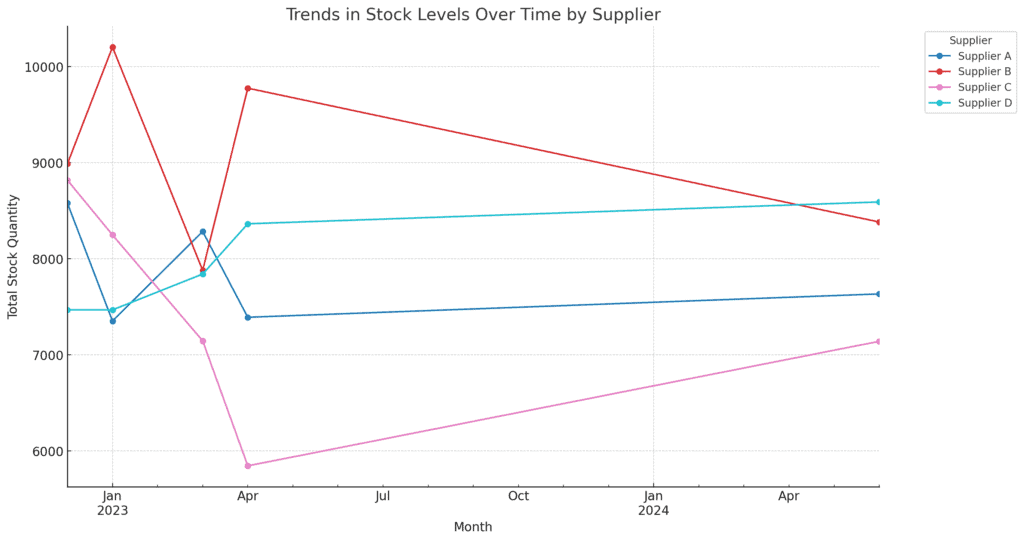
The line chart compares stock trends across different suppliers over time. Here are some insights:
- Distinct Patterns for Each Supplier:
- Each supplier exhibits unique stock trends, reflecting differences in their supply schedules, product demand, or the variety of products they provide.
- Supplier A and Supplier D:
- These suppliers show relatively consistent stock levels over time, with minor fluctuations. This could indicate steady supply and demand for the products they provide.
- Supplier D:
- This supplier shows more significant fluctuations, with periods of high restocking followed by sharp declines. This could be due to high demand for specific products, irregular restocking, or seasonal effects.
- Supplier B:
- Supplier B seems to have the most volatile trend, with sharp peaks and valleys, possibly indicating challenges in maintaining consistent stock levels or varying demand for their products.
Summary of warehouse analysis
The analysis carried out above is by no means exhaustive but does provide a good starting point for further detailed analyses into specific aspects of the warehouse management data.
However, several key takeaways can be derived from the analysis performed so far.
Key observations
- Category and Product Management: Certain categories, such as Electronics and Furniture, maintain more stable stock levels, while others like Clothing and Toys show more volatility.
This suggests that some categories might benefit from more dynamic stock management strategies to prevent stockouts. - Supplier Dependency: The analysis revealed a significant dependency on a few key suppliers.
This concentration poses a risk if these suppliers face supply chain disruptions. Diversifying the supplier base could help mitigate this risk. - Warehouse Utilisation: Different warehouses exhibit unique stock level trends, with some showing significant fluctuations.
Understanding these trends allows for better space utilisation and inventory distribution across warehouses. - Stock Trends: The analysis of stock trends over time indicates that certain products and suppliers follow specific restocking patterns.
Recognising these patterns can help in scheduling restocks more effectively and reducing the risk of stockouts.
Suggestions for Improvement at the Warehouse
- Dynamic Inventory Management:
- Implement more dynamic inventory management practices that adjust stock levels based on real-time demand and sales forecasts.
This can help prevent stockouts, especially for high-demand products.
- Implement more dynamic inventory management practices that adjust stock levels based on real-time demand and sales forecasts.
- Supplier Diversification:
- Consider diversifying the supplier base to reduce dependency on a few key suppliers.
This will improve supply chain resilience and reduce the risk of disruptions.
- Consider diversifying the supplier base to reduce dependency on a few key suppliers.
- Warehouse Optimisation:
- Review warehouse utilisation to optimise space and ensure that high-demand products are easily accessible.
Implementing advanced warehouse management systems (WMS) can aid in better space utilisation and inventory tracking.
- Review warehouse utilisation to optimise space and ensure that high-demand products are easily accessible.
- Data-Driven Decision Making:
- Utilise the insights gained from stock trends to inform decision-making. Regularly monitor these trends to adjust inventory policies, restocking schedules, and supplier relationships.
- Seasonal Planning:
- Given the observed fluctuations in certain categories, implementing seasonal planning can help manage inventory levels more effectively.
Adjust stock levels ahead of peak seasons based on historical data.
- Given the observed fluctuations in certain categories, implementing seasonal planning can help manage inventory levels more effectively.
Conclusion
This basic yet detailed analysis of warehouse stock trends offers valuable insights into the dynamics of warehouse management.
By understanding how different factors such as product categories, suppliers, and warehouses impact stock levels, businesses can make more informed decisions, optimise their supply chains, and improve overall efficiency.
Whether it’s managing stockouts, enhancing supplier relationships, or optimising warehouse space, the insights gained from this analysis can lead to more effective and strategic warehouse management.