
How to prepare data for Power BI dashboard using Excel dataset: A beginner’s guide
Introduction
Creating effective Power BI dashboards starts with properly prepared data. This guide provides a step-by-step approach to preparing data for visualisation in Power BI, using a sample Excel dataset.
By following these instructions, beginners can transform raw data into meaningful insights that are ready for analysis and presentation.
Please check out the lessons below on how to transform data from web source with Power Query and how to create a Power BI dashboard.
1. Dataset used
- The dataset we will use for this lesson is Microsoft Excel file named “Financial Sample.”
- You can download the dataset by clicking on the image below. Please ensure to store the dataset in an appropriate location on your computer.

2. Importing data
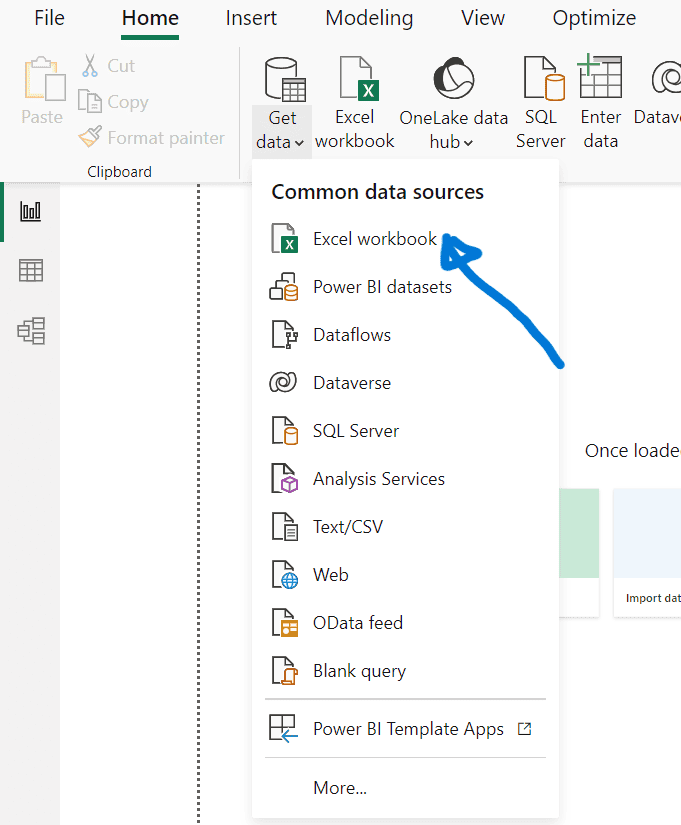
- Launch your Power BI Desktop application.
- From the Home tab, select “Get data,” then choose “Excel workbook” from the dropdown menu.
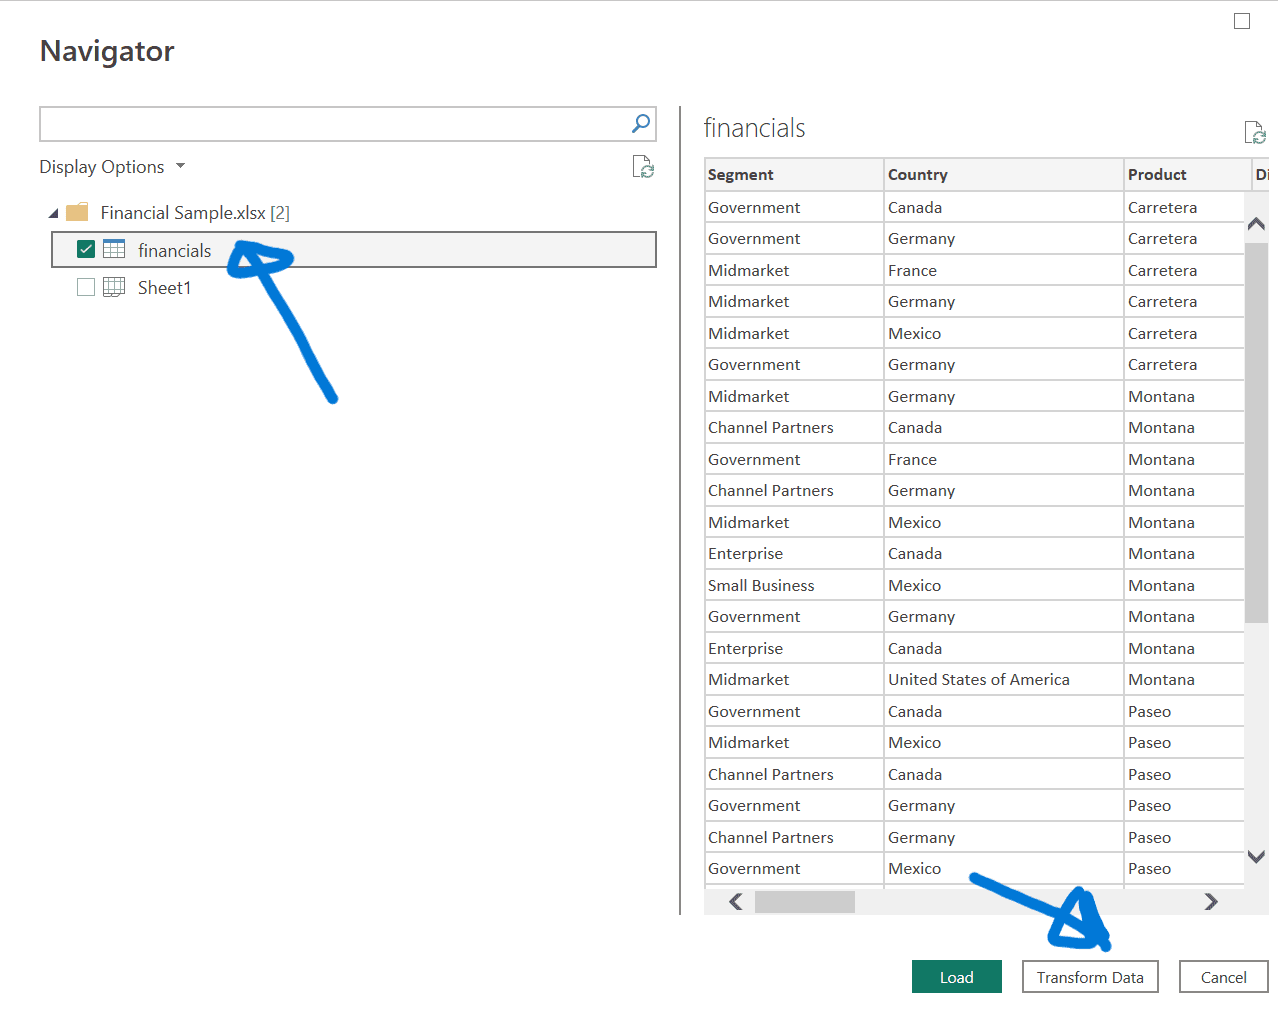
- In the Navigator window that appears, select the “Financials” table and click “Transform Data” to start data preparation.
3. Data transformation steps
Change Data Type:
- Select the “Units Sold” column.
- Go to the Transform tab, choose “Data Type,” and select “Whole Number.”
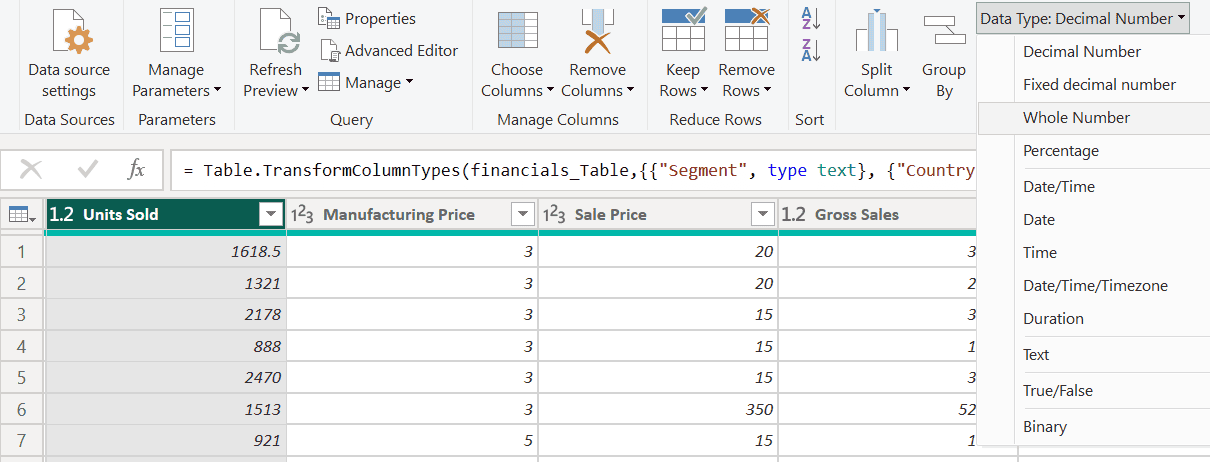
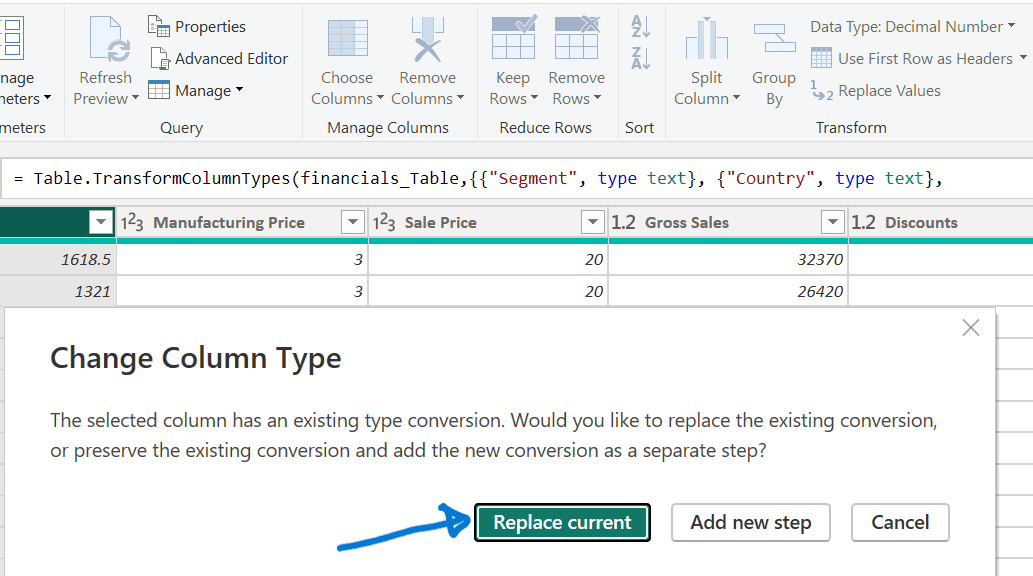
- Confirm by selecting “Replace current” to apply the change.
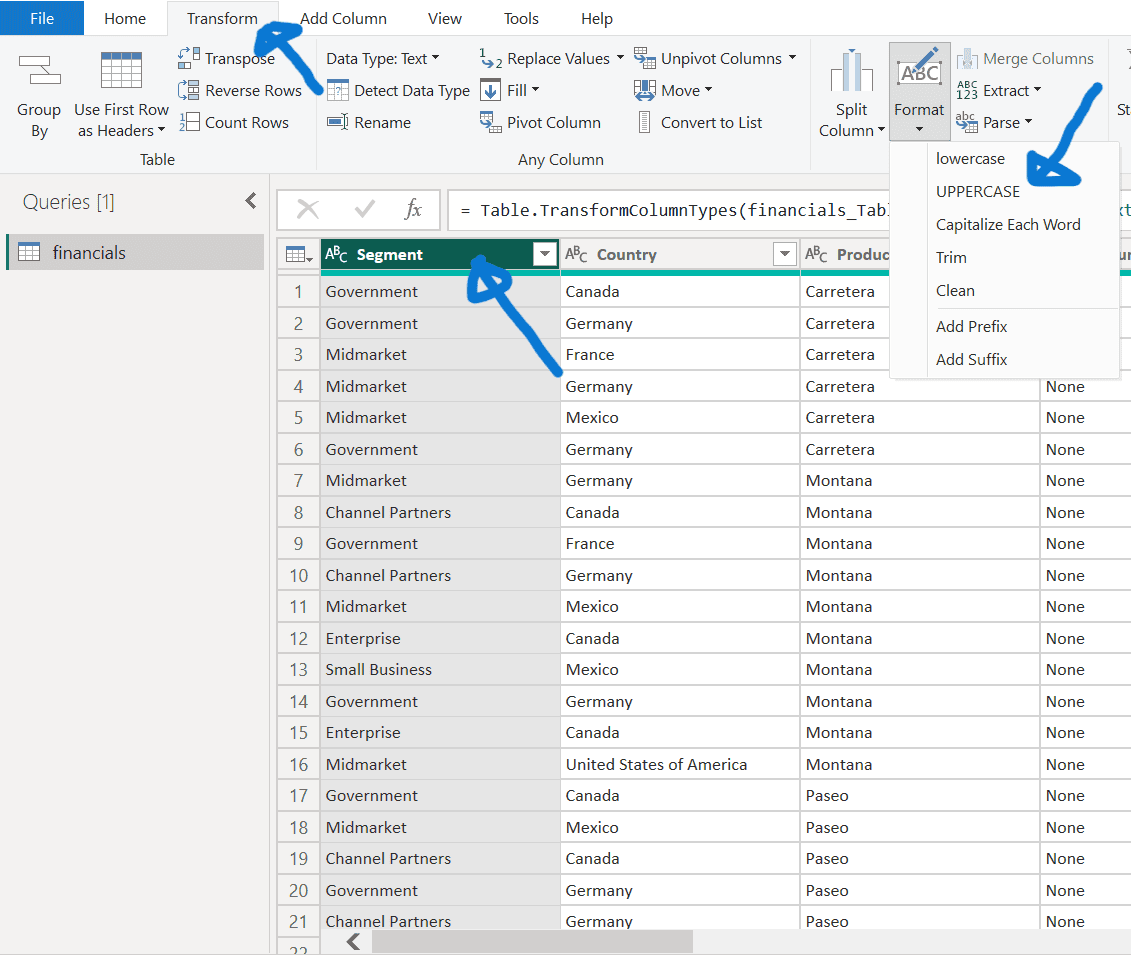
Change Text Format:
- Select the “Segment” column.
- In the Transform tab, click “Format” and choose “UPPERCASE.”
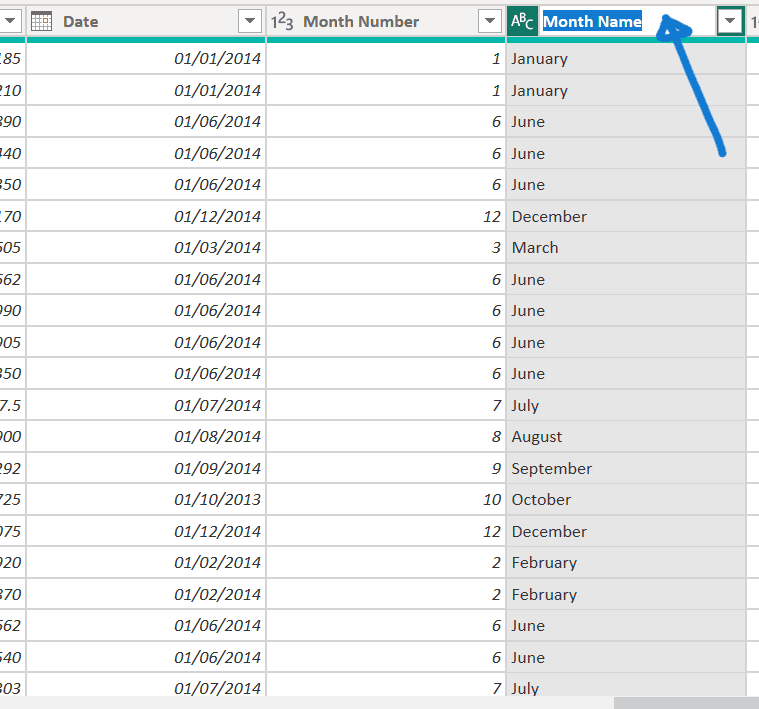
Rename Columns:
- Double-click the “Month Name” column and rename it to “Month.”
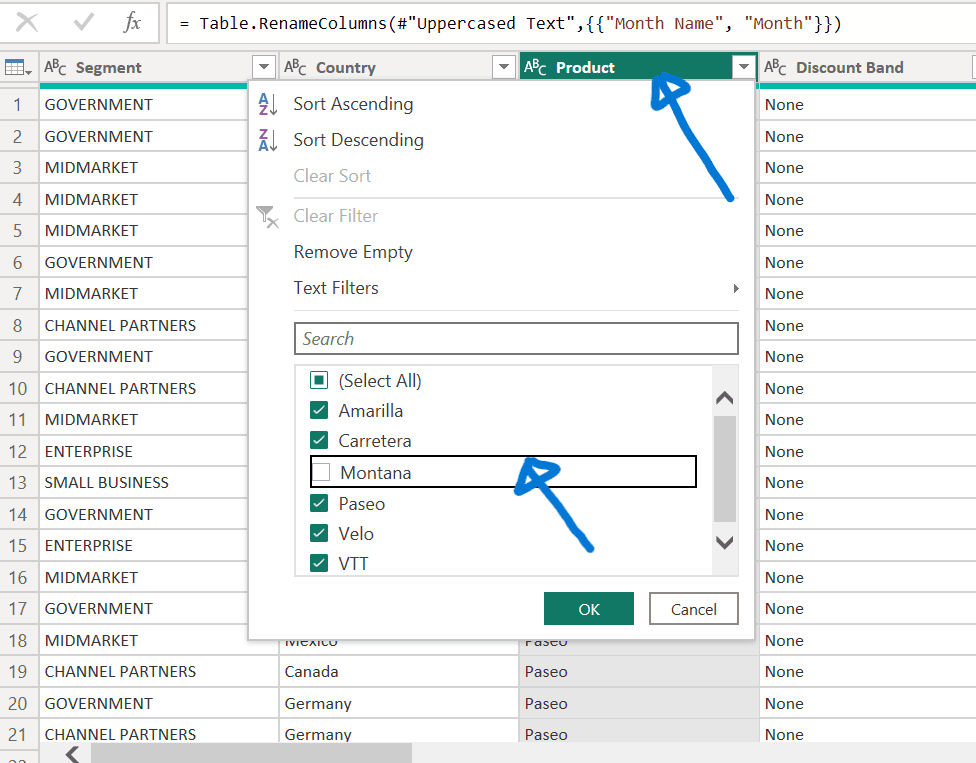
Filter Data:
- Click the dropdown in the “Product” column and uncheck the box next to “Montana” to filter out this discontinued product.
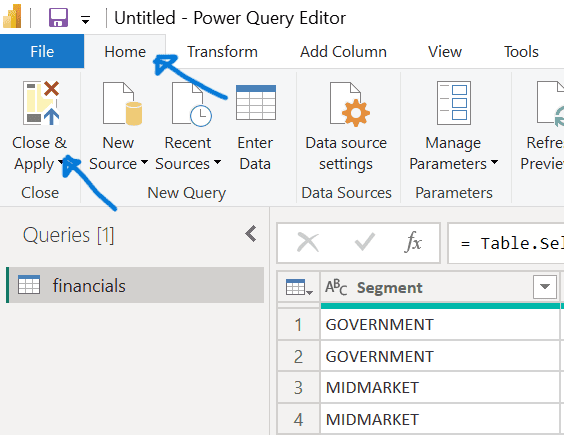
4. Applying and reviewing changes
- Check the “Query Settings” pane under “APPLIED STEPS” to see all transformations made.
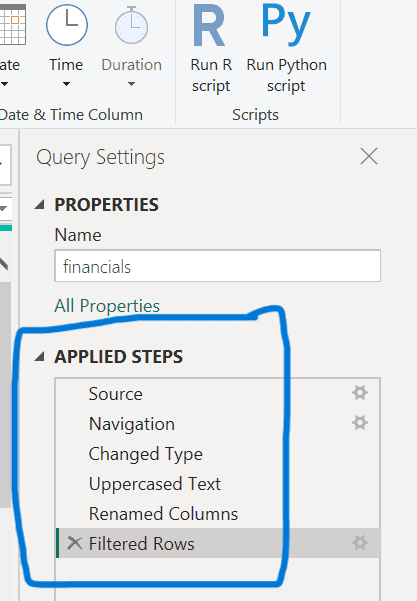
- To finalise, go to the Home tab and select “Close & Apply” to apply all changes.
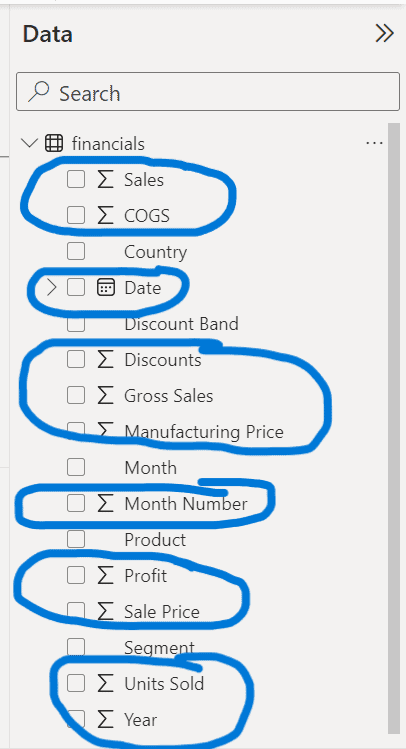
5. Verifying data
- Ensure to save your work if you have not already done so.
- Check the right pane to ensure that Power BI correctly identifies numeric fields (with the Sigma symbol) and date fields (with the calendar symbol).
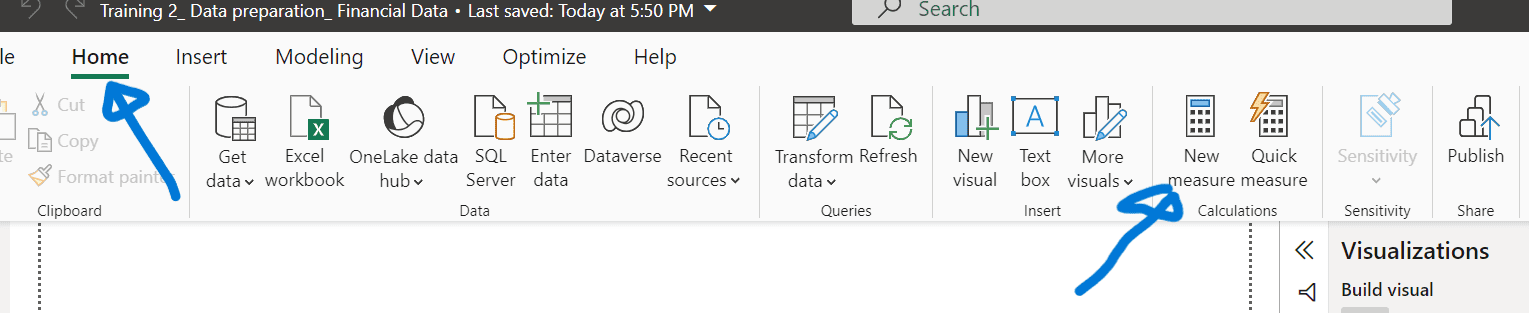
6. Creating Measures and Tables
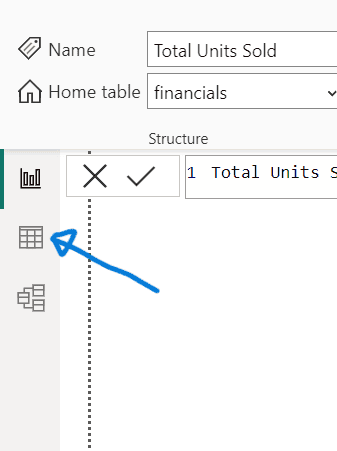
Create a Measure
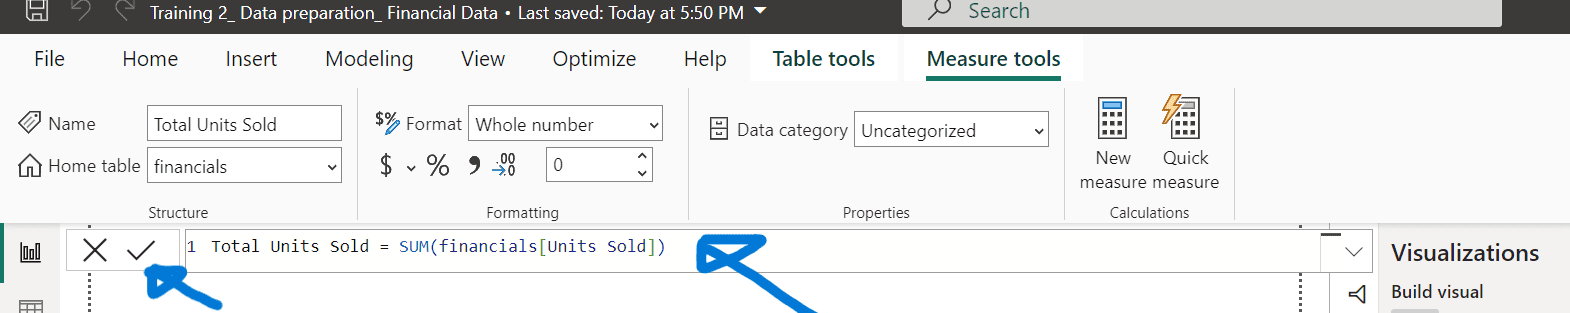
- On the Home ribbon, select “New measure.”
- Enter the expression: Total Units Sold = SUM(financials[Units Sold]) and confirm.
Create a Calendar Table
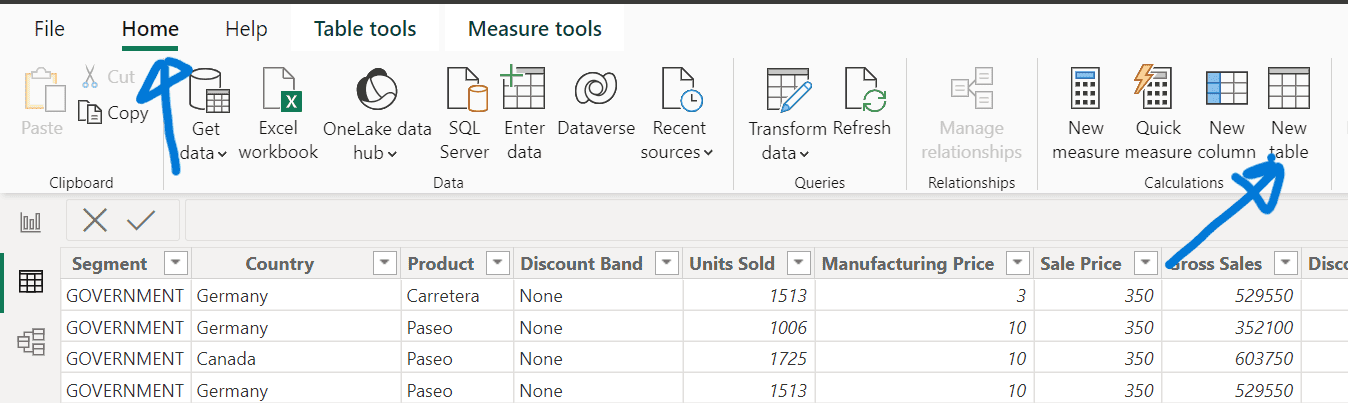
- Switch to Data view on the left.
- On the Home ribbon, select “New table”.
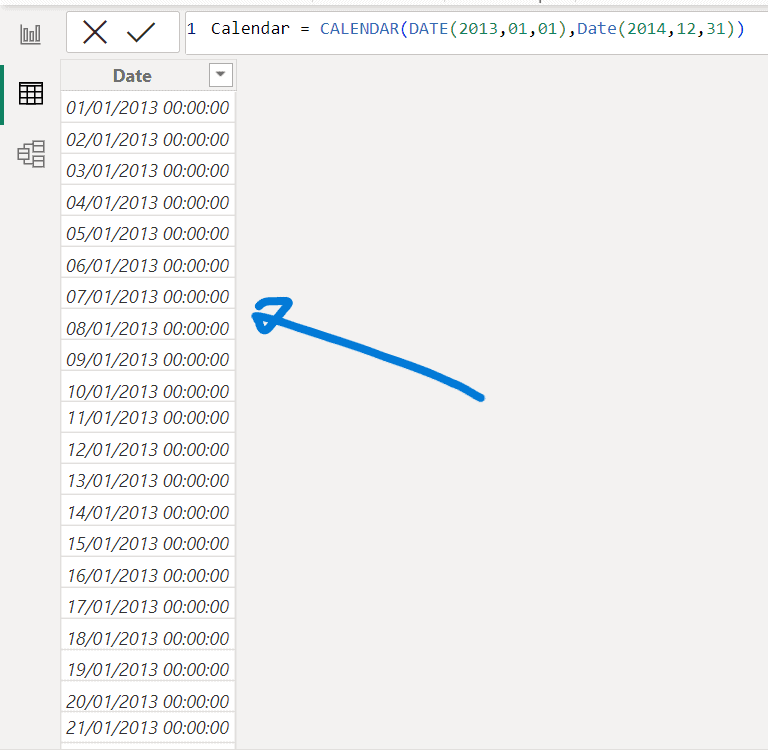
- Enter the expression: Calendar = CALENDAR(DATE(20130101), DATE(20141231)).
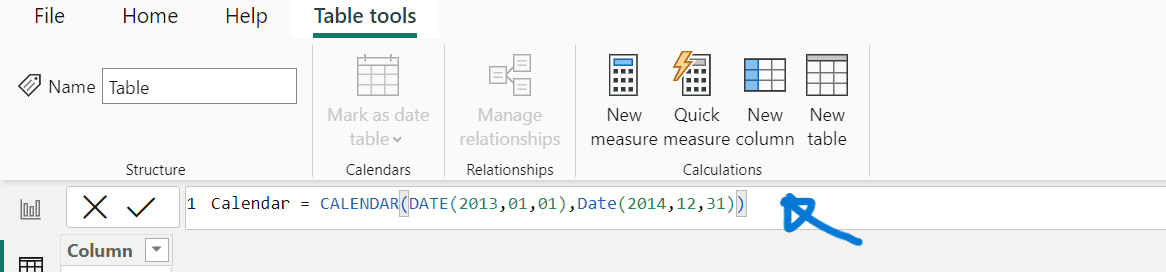
- Confirm and ensure a table of dates from January 1, 2013, to December 31, 2014, has been created.
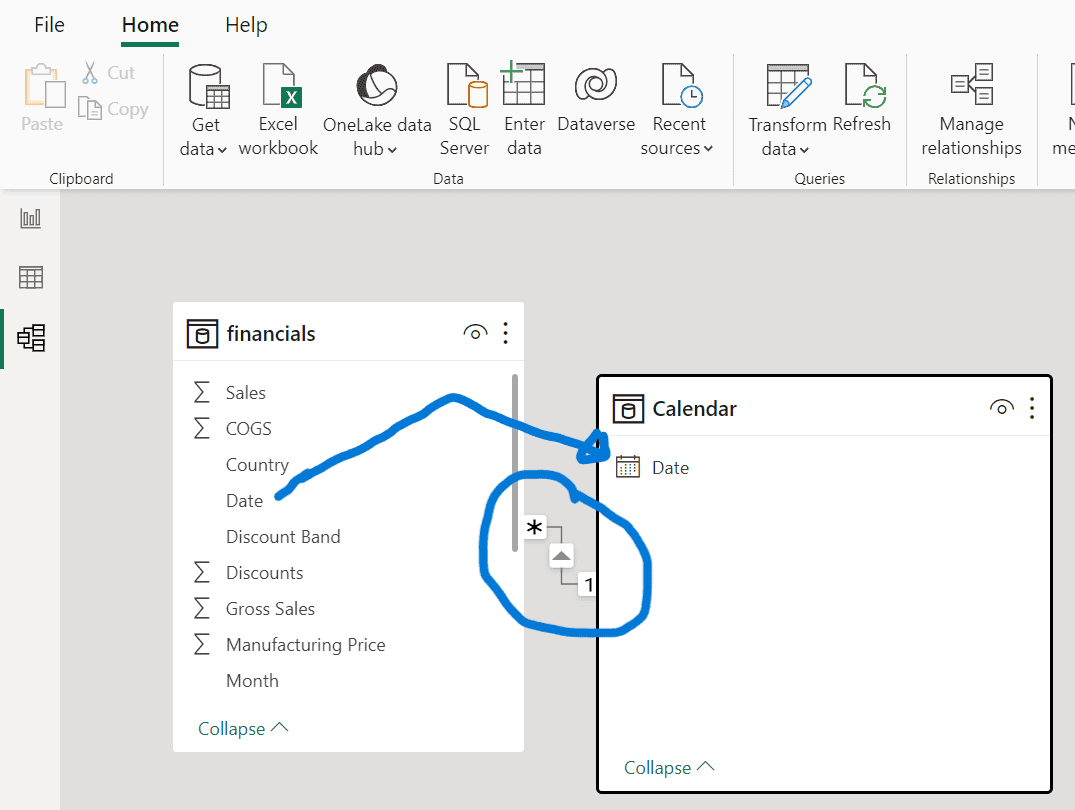
7. Establishing relationships
- Switch to Model view on the left.
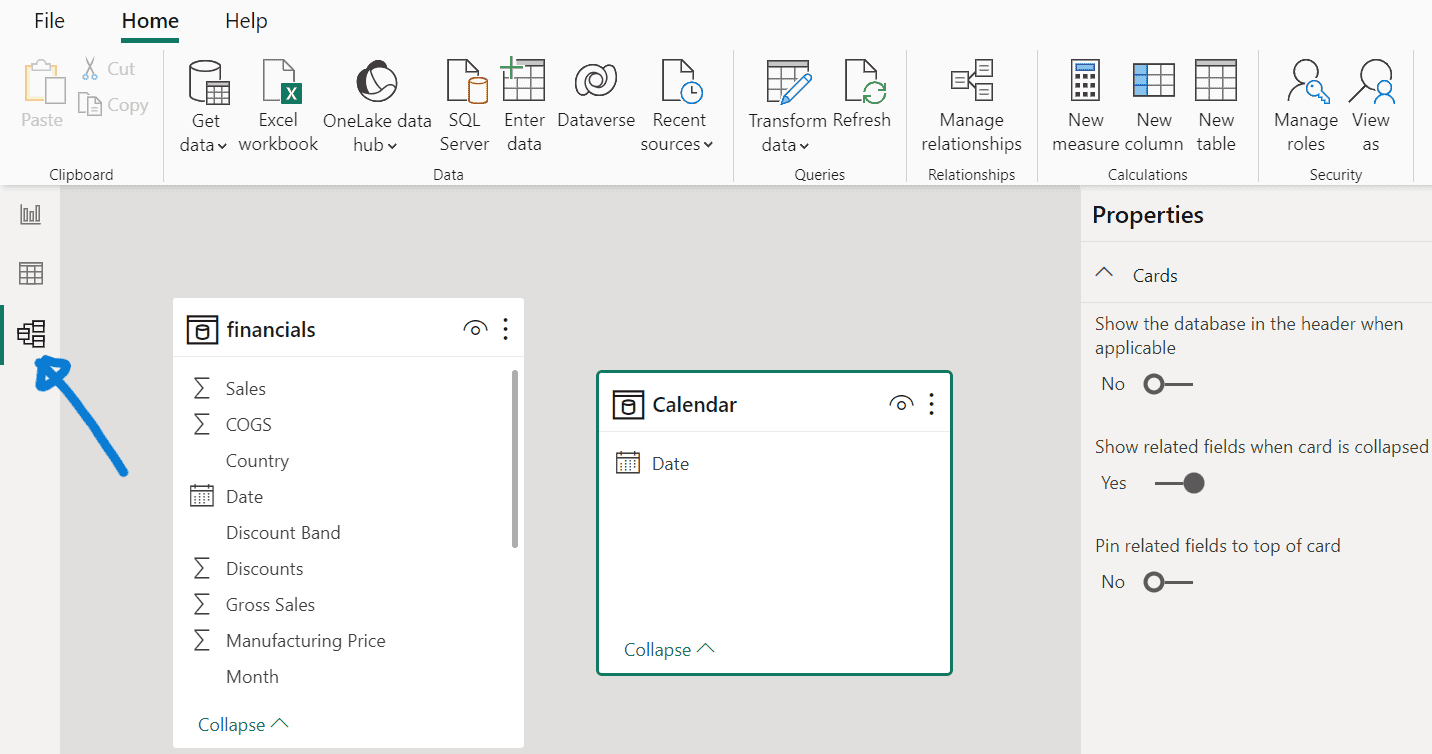
- Drag the “Date” field from the “financials” table to the “Date” field in the “Calendar” table to create a relationship between the tables.
Wrapping up
This guide has outlined the essential steps to prepare data for a Power BI dashboard, making it suitable for beginners.
The process begins with importing data from a Microsoft Excel file into Power BI Desktop. Once the data is imported, users are guided through a series of transformations to clean and format the data.
Key steps include changing data types, formatting text, renaming columns, and filtering out unwanted data.
After transformations, the guide emphasised reviewing and applying these changes to ensure accuracy. It also covered verifying data formats, such as identifying numeric and date fields.
To enhance data analysis, the guide described creating measures and tables, such as a “Total Units Sold” measure and a date-based calendar table.
Finally, relationships between different tables using the Model view were established to aid in linking data logically, facilitating more comprehensive analysis and reporting.
By following these steps, users can effectively prepare and manage data, laying a solid foundation for building insightful Power BI dashboards.


4 responses
[…] follow this link for a further step-by- step guide on how to prepare data for a dashboard using data from a […]
[…] How to prepare data for Power BI dashboard using Excel dataset: A beginner’s guide […]
[…] How to prepare data for Power BI dashboard using Excel dataset. […]
[…] How to prepare data for Power BI dashboard using Excel dataset. […]