
How to transform data using Power Query: A beginner’s guide
Introduction
Power Query is a powerful data connection technology that allows you to discover, connect, combine, and refine data across a wide variety of sources.
This guide will provide a detailed step-by-step process on how to transform data using Power Query in Power BI.
By following these instructions, you’ll be able to handle data more efficiently and effectively, making it easier to draw insights and make data-driven decisions.
If you are new to Power BI, and need a guide on how to install Power BI on your computer please check out the link below:
Initial setup and getting data
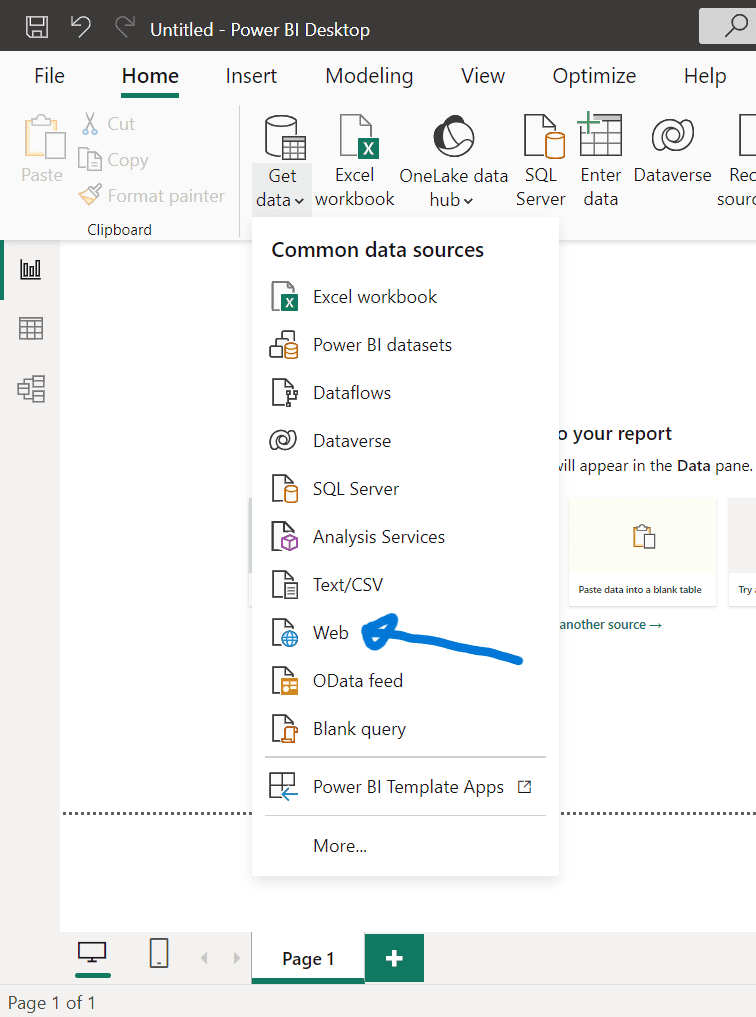
- Launch the Power Desktop app on your computer.
- From the Home tab or menu, select ‘Get Data’.
- From the dropdown menu choose ‘Web’.
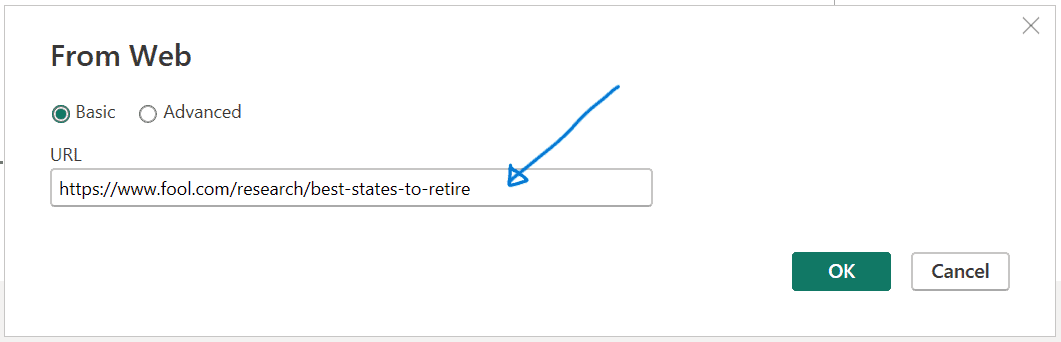
Inputting the Web URL
- Enter the URL shown in the ‘From Web’ dialog box below or use this link.
- Click ‘OK’ to proceed.
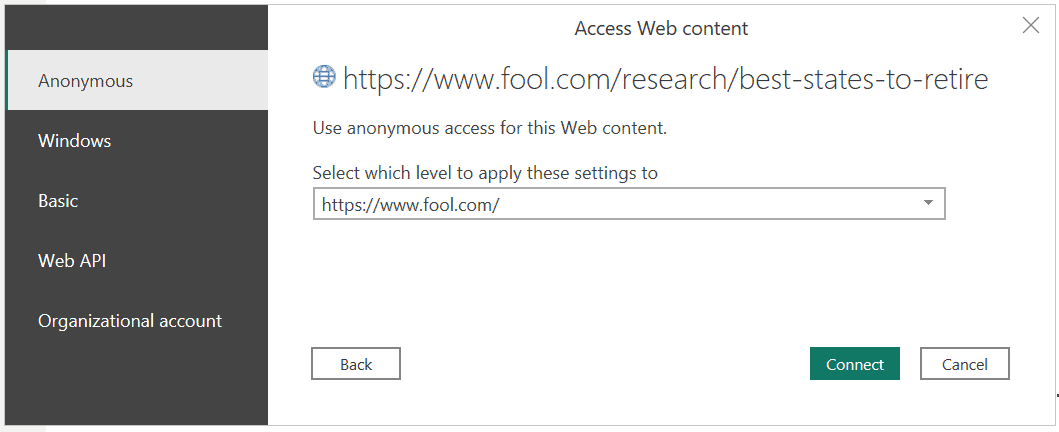
3. If prompted, select ‘Anonymous Access’ to connect to the web content and click ‘Connect.’
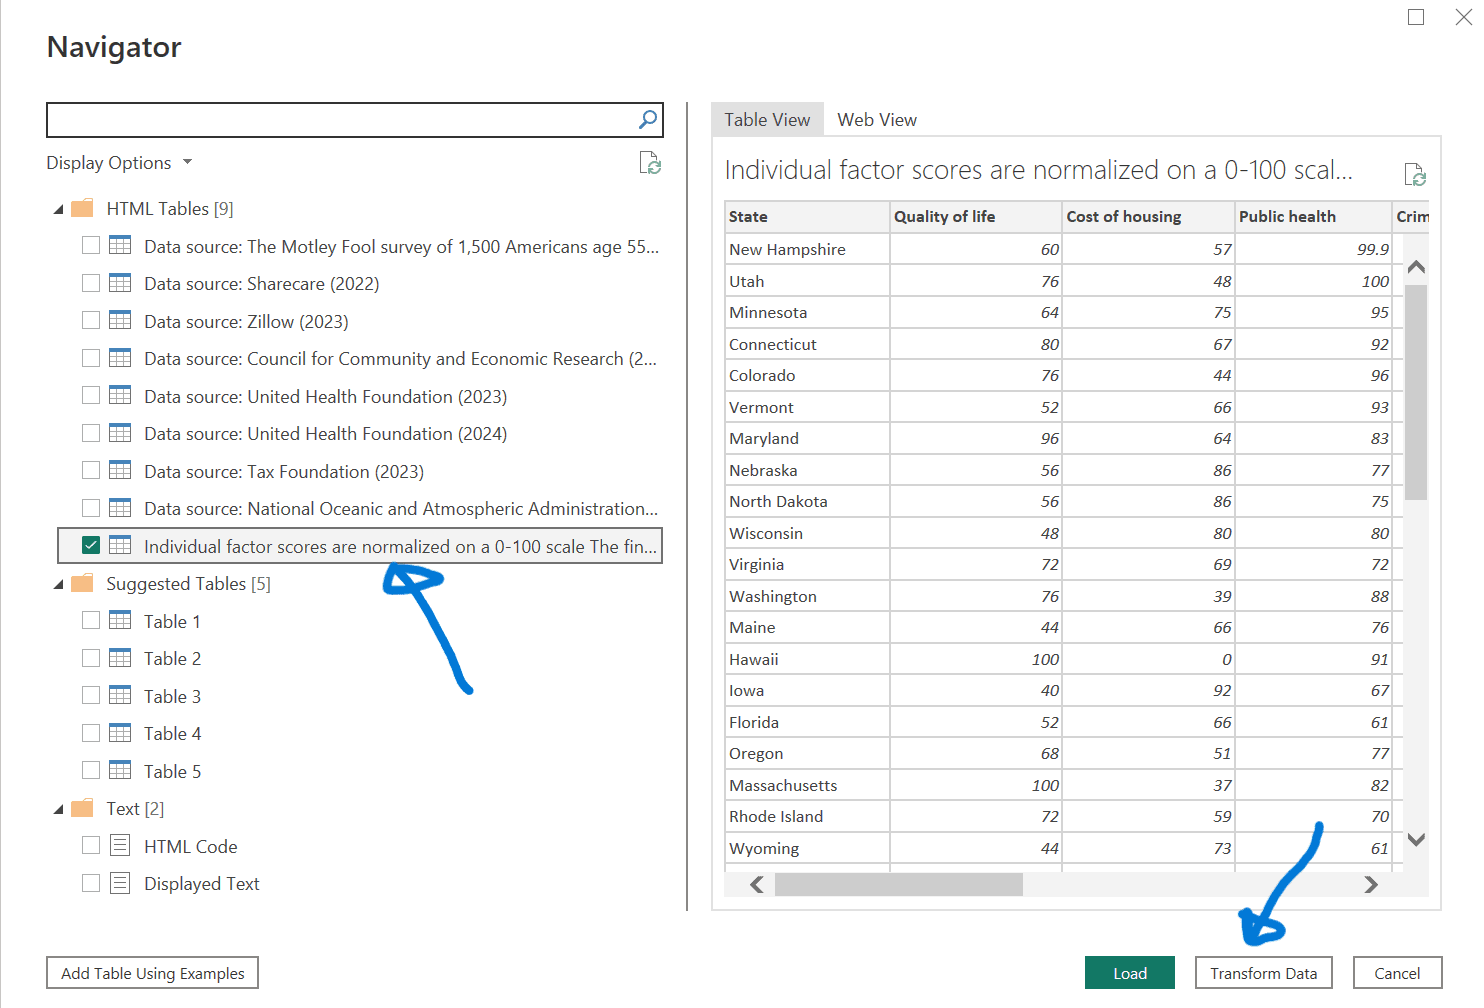
Selecting the appropriate table
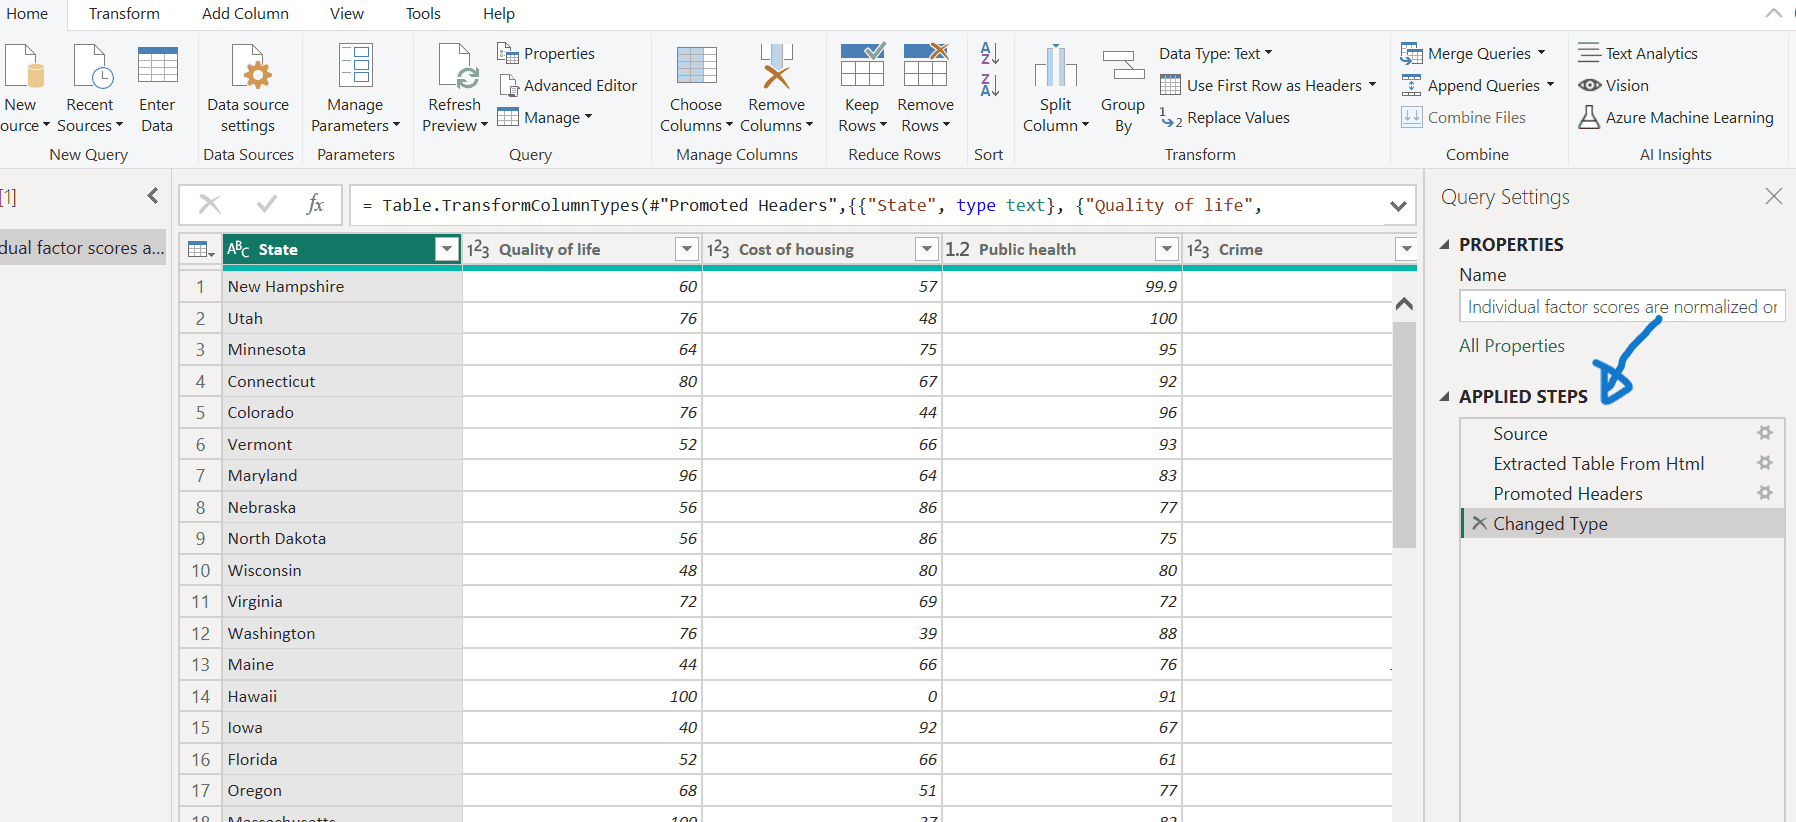
- In the Navigator window, choose the table labeled ‘Individual factor scores are normalized on a 0-100 scale…’.
- Click on ‘Transform Data’ to open the Power Query Editor.
Working in the Power Query editor
- The Power Query Editor will open, displaying the default actions in the ‘Query Settings’ panel under ‘APPLIED STEPS’ as shown below.
- You may change the name of the table to what you wish and the press Enter.
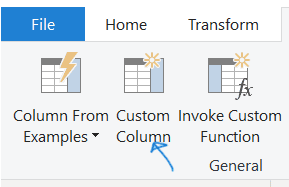
Adding and customising columns
- Navigate to the ‘Add Column’ ribbon and select ‘Custom Column.’
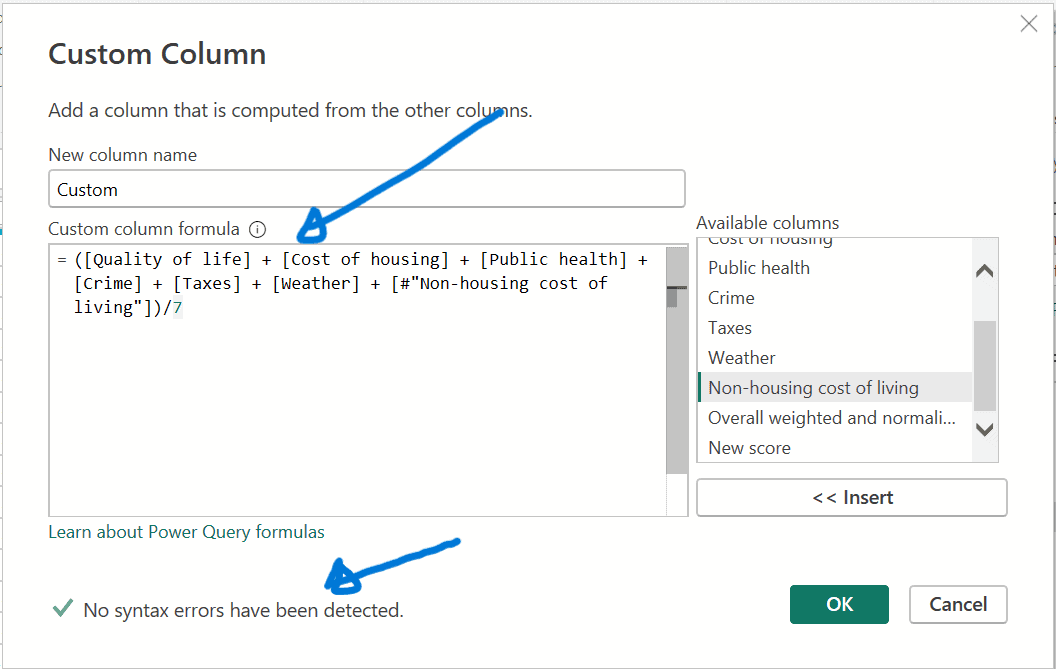
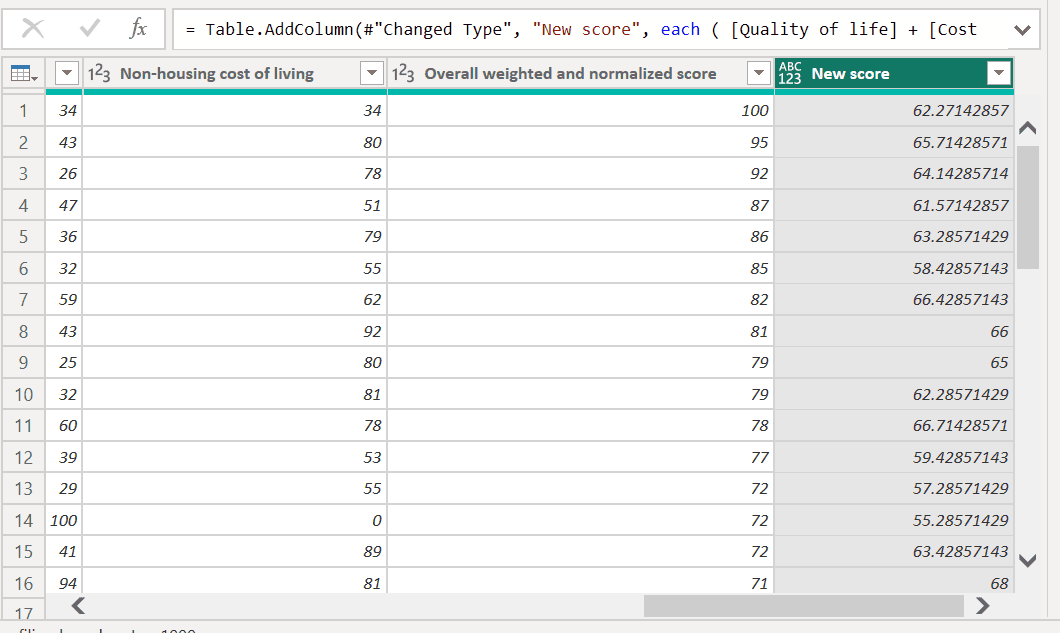
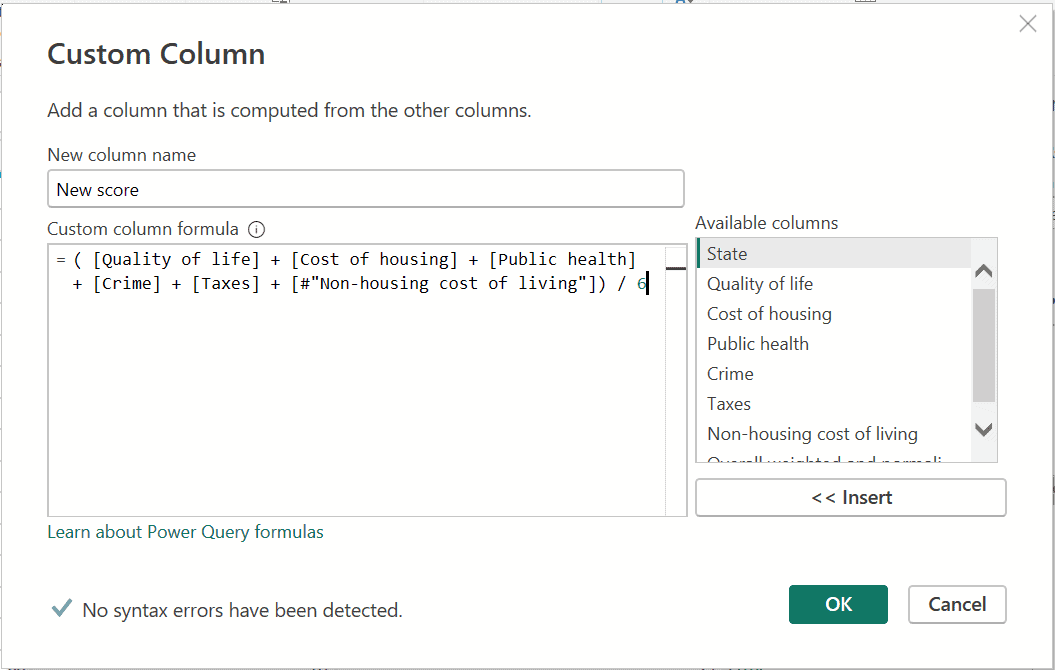
- In the Custom Column dialog box, enter ‘New score’ as the column name (or any other name you prefer) and provide the desired formula as shown below.
- Ensure that the status message at the bottom is set as ‘No syntax errors have been detected’
- Then click ‘OK’.
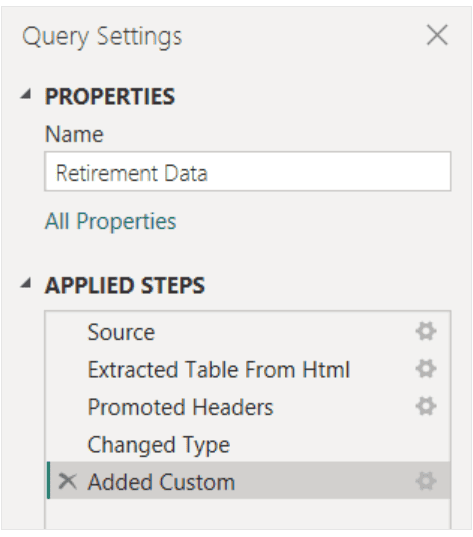
Reviewing applied steps
Check the ‘Query Settings’ panel to see that the newly added custom step is now listed under ‘APPLIED STEPS.’
Adjusting and transforming data
Before proceeding with this query, let’s modify it to better suit our data requirements. We will do the following:
- Adjust the rankings by removing a column.
- Fix errors.
- Sort the data.
- Replace the data.
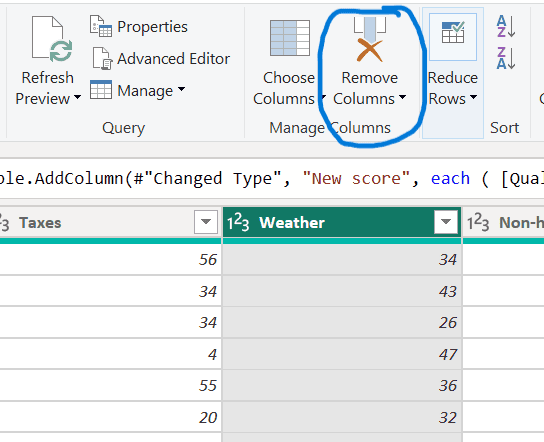
- Select the ‘Weather’ column and remove it by clicking ‘Remove Columns’ from the Home tab.
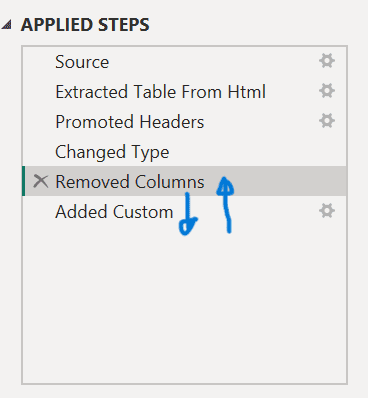
2. Right-click the ‘Removed Columns’ step and move it above the ‘Added Custom’ step to adjust the order of operations as shown below.
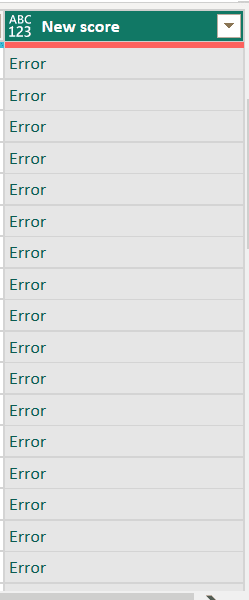
Observe that the New score column now displays “Error” instead of the calculated value.
To get more information about each error, select the column and Power Query Editor will display the details.
Two changes are required to fix the error: remove the Weather column name and change the divisor from 7 to 6.
These can be done in either of the following ways:
- Right-click the “Added or Column” step and select “Edit Settings.” This will open the Custom Column dialog used to create the New score column.
- Modify the formula as previously described (i.e. remove Weather and change the divisor from 7 to 6).
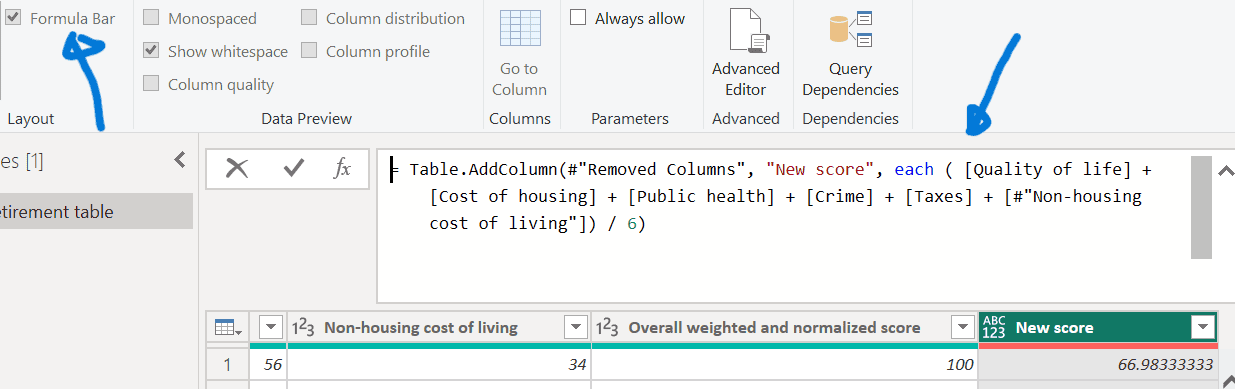
- Select the New score column, then enable the Formula Bar checkbox from the View tab to display the column’s data formula.
- Modify the formula as previously described until it appears as follows, then press Enter.
Sorting and replacing values
- To sort data, select the ‘Added Custom’ step, click the dropdown next to the ‘New score’ column header, and choose ‘Sort Descending.’
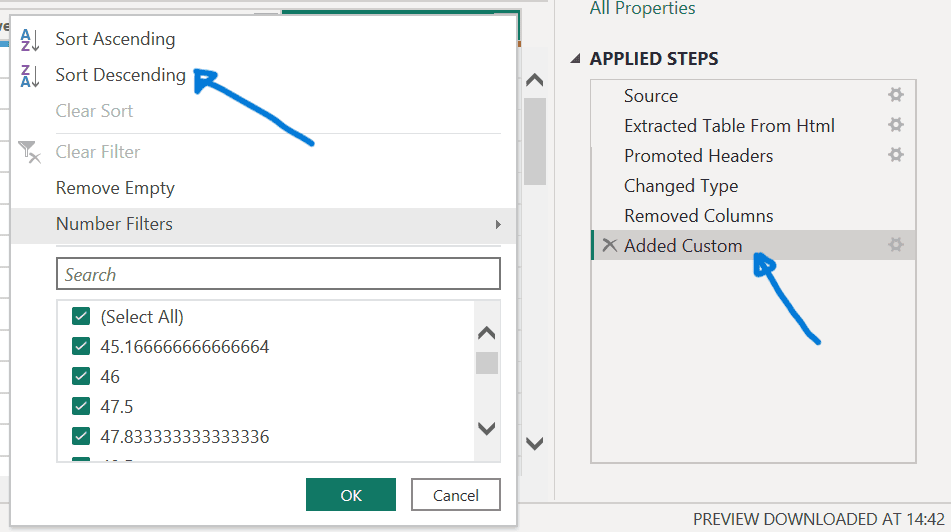
Notice how Power Query Editor automatically adds a new step immediately after the currently selected applied step.
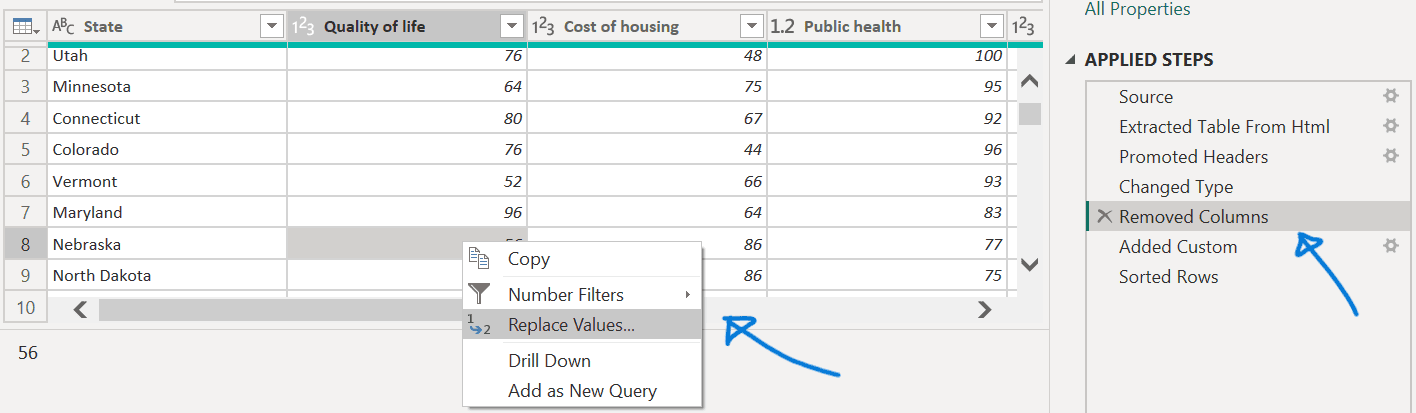
- In APPLIED STEPS, select the step before the custom column, i.e, Removed Columns step.
- Right-click the cell with Nebraska value Quality of life ranking.
- Select Replace Values.
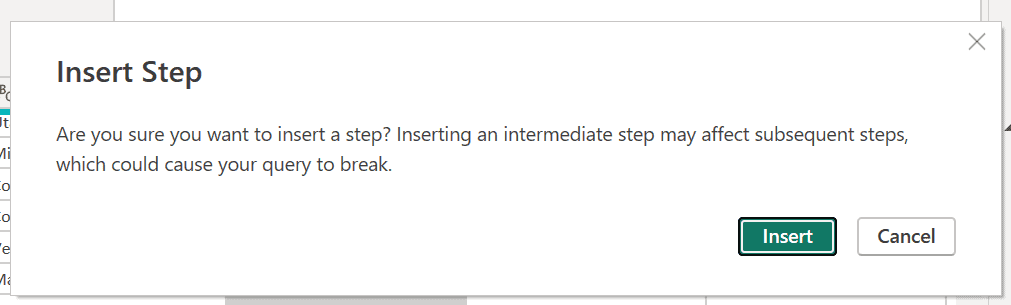
Power Query Editor notifies us that subsequent steps might break the query as we’re inserting a new step.
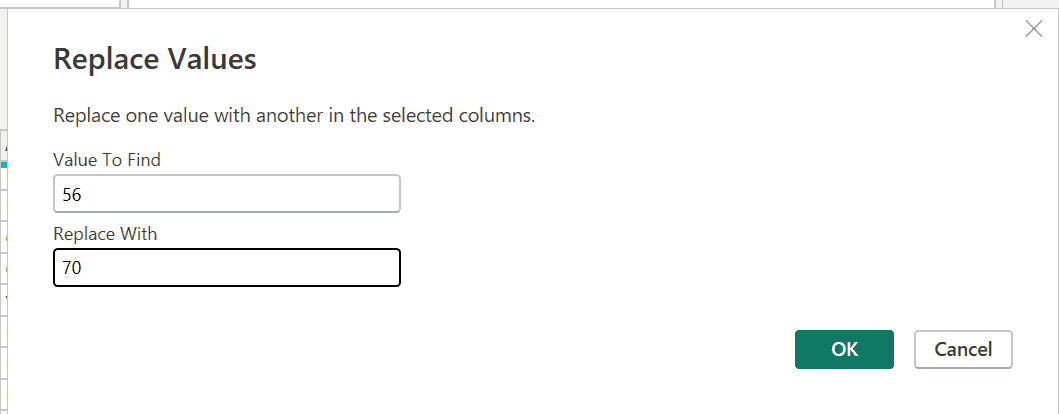
- Replace the data value to 70.
- Select OK. Power Query Editor now substitutes the data for Nebraska.
Reviewing final changes
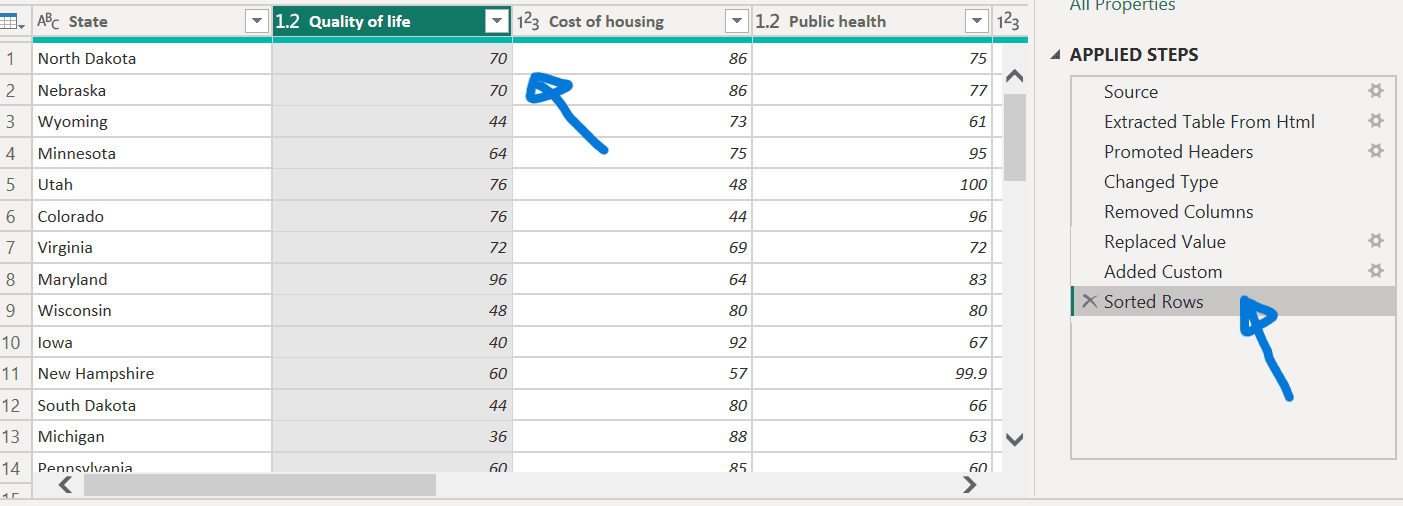
Notice how the Power Query Editor names a new entry (Replaced Column) in APPLIED STEPS.
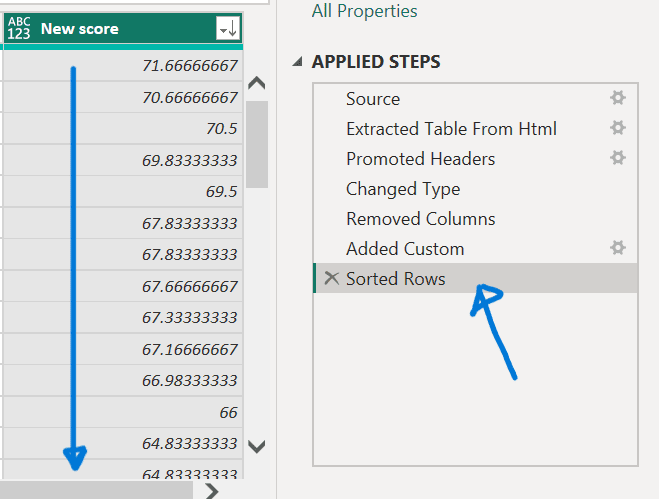
- Select the last Applied Step, Sorted Rows.
Notice the data has changed regarding Nebraska’s new ranking.
Please follow this link for a further step-by- step guide on how to prepare data for a dashboard using data from a spreadsheet application such as Microsoft Excel.
Wrapping up
This guide has provided a basic overview of using Power Query in Power BI to transform and manage data efficiently.
It begins with the initial setup of Power BI Desktop and explains how to get data from a web source.
Users are guided through inputting a URL, selecting the appropriate data table, and navigating the Power Query Editor interface.
The guide also covered adding and Customising columns, including defining new columns using custom formulas.
It explained how to review and adjust applied steps, remove unnecessary columns, and reorder steps to ensure accurate data transformation.
It also included instructions on handling errors, sorting data, and replacing specific values to meet data requirements.
The process concludes with reviewing final changes to ensure that all data transformations are correctly applied,
This guide should empower beginners to leverage Power Query’s capabilities to create meaningful reports and gain valuable insights from their data.


4 responses
[…] How to transform data using Power Query: A beginner’s guide. […]
[…] How to transform data using Power Query. […]
[…] How to transform data using Power Query. […]
[…] refer to this article for more on data […]