How to analyse and unlock retail insights from a superstore data using Python
Introduction
The vast amounts of retail data that accumulate from day-to-day transactions can provide valuable insights into product performance, customer segmentation, and market trends.
In this project, we will carry out a detailed analysis of a retail dataset, exploring various aspects such as sales trends, geographical performance, and customer segmentation using RFM (Recency, Frequency, Monetary) analysis.
Through a combination of relevant exploratory data analysis and visualisation, we aim to uncover actionable insights that can drive strategic decisions in retail management.
Superstore dataset
The dataset for this project contains transactional records related to orders made at a Superstore, including details about customers, products, sales, and shipping.
Here’s a detailed description of the dataset:
Overview:
- Total Rows: 9,994
- Total Columns: 21
- Data Type: Mixed (Numerical and Categorical)
The dataset for this analysis can be downloaded from this GitHub link and kaggle. The Python code for the analysis can be downloaded here.
Column Descriptions:
- Row ID: A unique identifier for each row/record in the dataset.
- Order ID: A unique identifier for each order. Multiple rows can share the same Order ID if multiple products were purchased in a single order.
- Order Date: The date on which the order was placed. This is in datetime format.
- Ship Date: The date on which the order was shipped. This is also in datetime format.
- Ship Mode: The method of shipment (e.g., Second Class, Standard Class, First Class, Same Day).
- Customer ID: A unique identifier for each customer.
- Customer Name: The full name of the customer who placed the order.
- Segment: The market segment to which the customer belongs (e.g., Consumer, Corporate, Home Office).
- Country: The country where the customer is located. In this dataset, it seems all entries are from the United States.
- City: The city where the customer is located.
- State: The state where the customer is located.
- Postal Code: The postal code of the customer’s location.
- Region: The geographical region within the country (e.g., West, East, Central, South).
- Product ID: A unique identifier for each product.
- Category: The high-level category of the product (e.g., Furniture, Office Supplies, Technology).
- Sub-Category: The specific sub-category of the product (e.g., Chairs, Binders, Phones).
- Product Name: The name or description of the product.
- Sales: The sales amount (revenue) generated from the transaction.
- Quantity: The number of units of the product that were ordered.
- Discount: The discount applied to the product (ranging from 0 to 0.8, representing 0% to 80%).
- Profit: The profit earned from the transaction, calculated as sales minus cost.
Key Features and Potential Retail Insights Analyses:
- Sales and Profit Analysis: Evaluate which products, categories, and regions generate the most sales and profit.
- Customer Segmentation: Use the Segment column to understand which customer segments are most valuable.
- Geographical Insights: Analyse the Region, City, and State columns to identify geographical trends in sales and profitability.
- Time Series Analysis: Use the Order Date and Ship Date to analyse trends over time, such as seasonal patterns or shipping performance.
- Discount Impact: Investigate how discounts impact sales and profit, using the Discount and Profit columns.
Summary Statistics
Metric | Sales ($) | Quantity | Discount ($) | Profit |
Mean |
|
|
|
|
Std |
| 2.22511 |
|
|
Min |
| 1 | 0 | -6599.98 |
Max | 22638.48 | 14 | 0.8 |
|
- The average sales per transaction is approximately $229.86, with a standard deviation of $623.24, indicating a wide variation in sales amounts.
- The average profit per transaction is approximately $28.66, with a wide range from a loss of $6,599.98 to a profit of $8,399.98.
- The average discount applied is around 15.62%, with some transactions having no discount and others having up to 80% discount.
Detailed analysis
Sales and Profit Analysis by Category
We will begin by analysing the total sales and profit by category and sub-category to identify which areas of the business are most and least profitable.
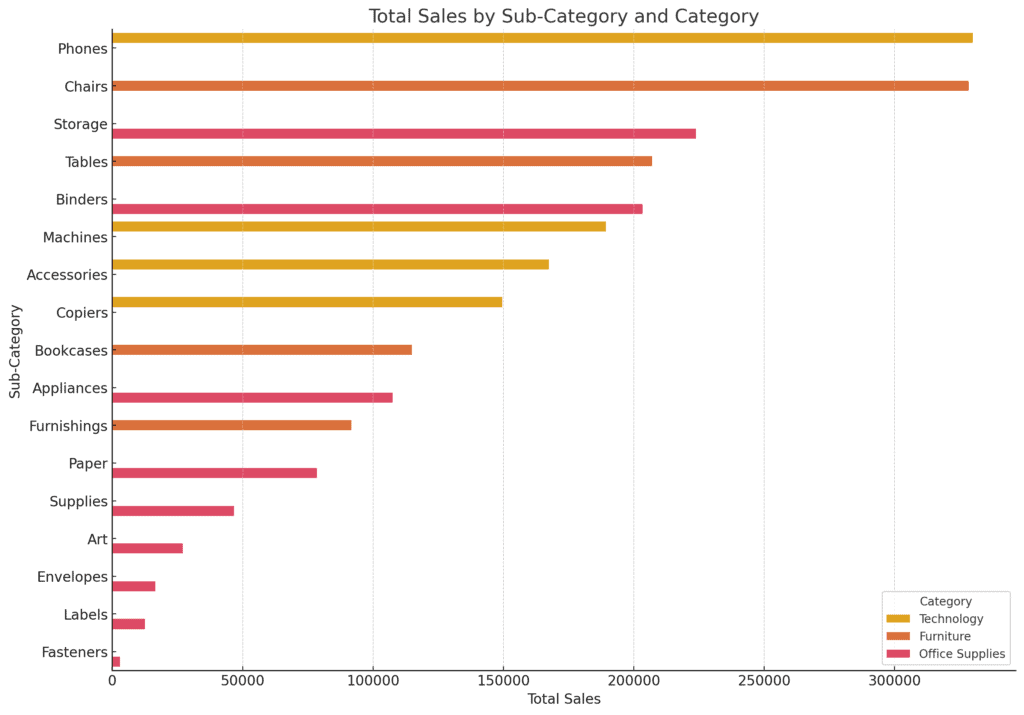
Sales Analysis:
- Technology category, particularly Phones, generates the highest sales ($330,007), followed by the Furniture category, with Chairs being the top seller ($328,449).
- Office Supplies also contributes significantly, with Storage and Binders being key sub-categories.
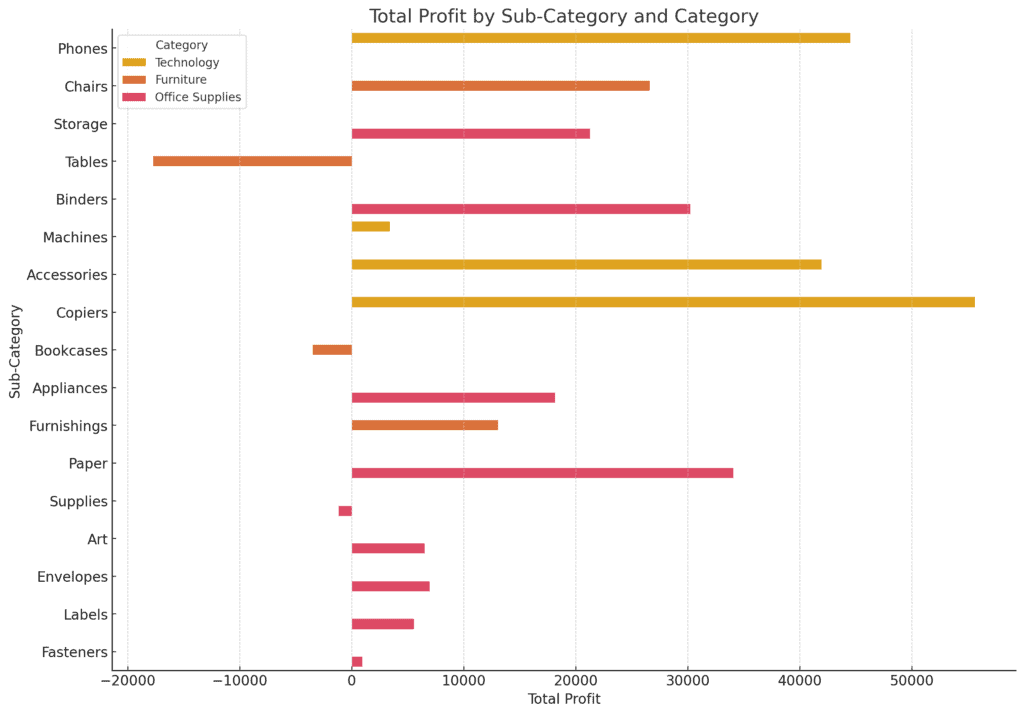
Profit Analysis:
- Phones in the Technology category not only lead in sales but also contribute the most to profits (~$44,515).
- In contrast, the Tables sub-category in the Furniture category has a negative profit (-$17,725), despite having relatively high sales ($206,966). This suggests that Tables might be heavily discounted or associated with high costs.
Trends Analysis
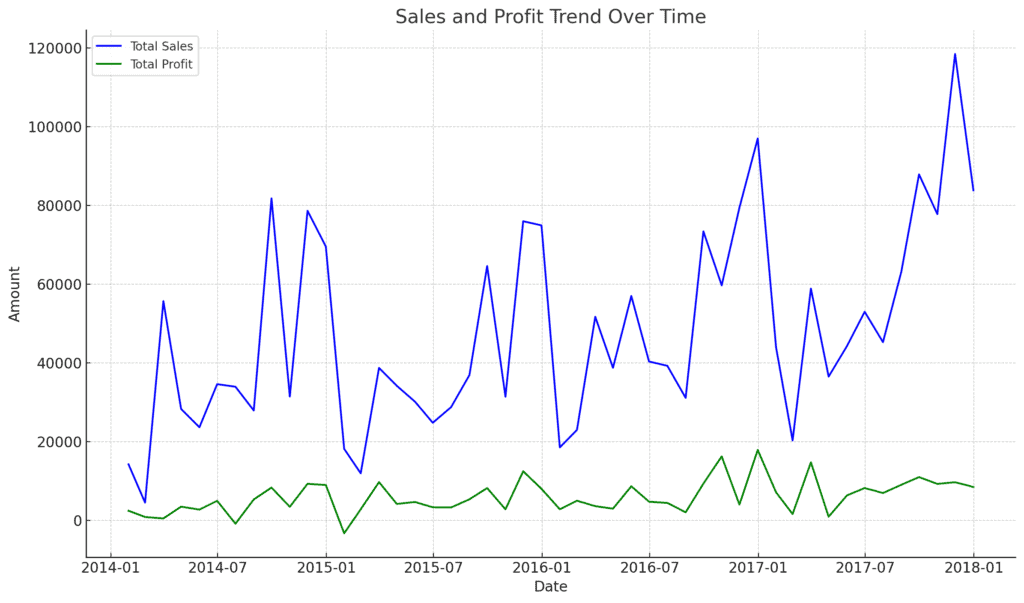
Sales and Profit Trends:
- The time series plot shows fluctuations in both sales and profit over the period analysed. Some months exhibit significant spikes in sales, which may correspond to seasonal trends or promotional activities.
- For instance, March 2014 shows a notable increase in sales (~$55,691) compared to the surrounding months, but this does not translate into a proportional increase in profit, indicating possible high costs or discounts during this period.
- The alignment (or lack thereof) between sales and profit suggests that while certain periods see high sales, profit margins may not always be robust. This could be due to factors such as discount strategies, inventory costs, or other operational expenses.
Geographical Analysis of Sales and Profit
Sales and Profit Distribution:
- The West region leads in both sales ($725,458) and profit ($108,418), making it the most lucrative region for the business.
- The East region also performs well, with sales ($678,781) and profit ($91,523) following closely behind.
- The Central region, despite having substantial sales ($501,240), has relatively lower profits ($39,706), indicating possible challenges in maintaining profitability.
- The South region, while the smallest in terms of sales ($391,722), still contributes a positive profit ($46,749).
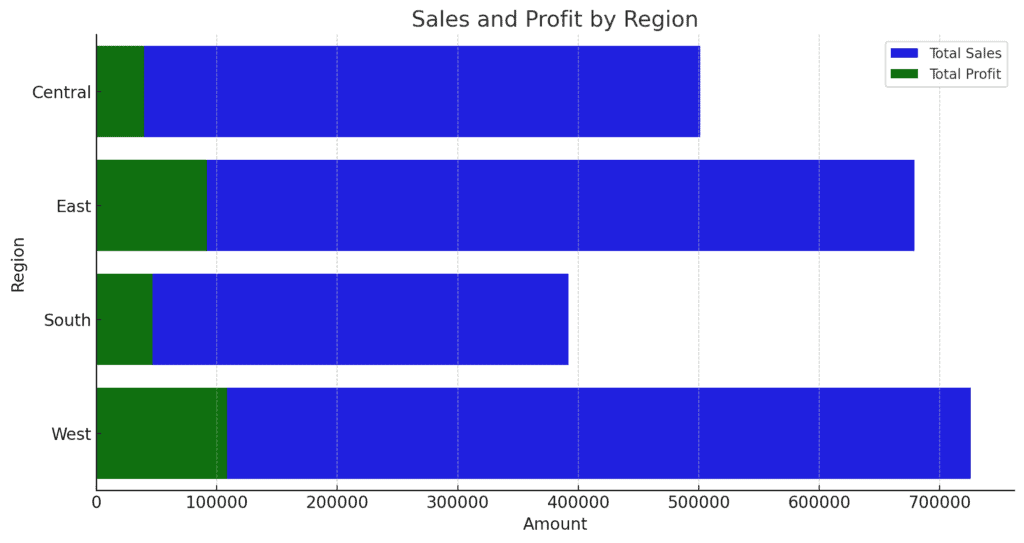
Insights:
- The regional performance highlights the importance of focusing on the West and East regions to drive both sales and profit.
- The lower profitability in the Central region suggests a need for further investigation into costs, pricing strategies, or market dynamics specific to that region.
Customer Segment Analysis of Sales and Profit
Sales and Profit Distribution:
- The Consumer segment is the largest contributor to both sales ($1.16 million) and profit ($134,119), indicating it as the primary target market.
- The Corporate segment, though smaller in terms of sales ($706,146), contributes a significant profit ($91,979), suggesting strong profitability within this segment.
- The Home Office segment, while the smallest in sales ($429,653), still shows a solid profit contribution ($60,299), indicating a healthy margin.
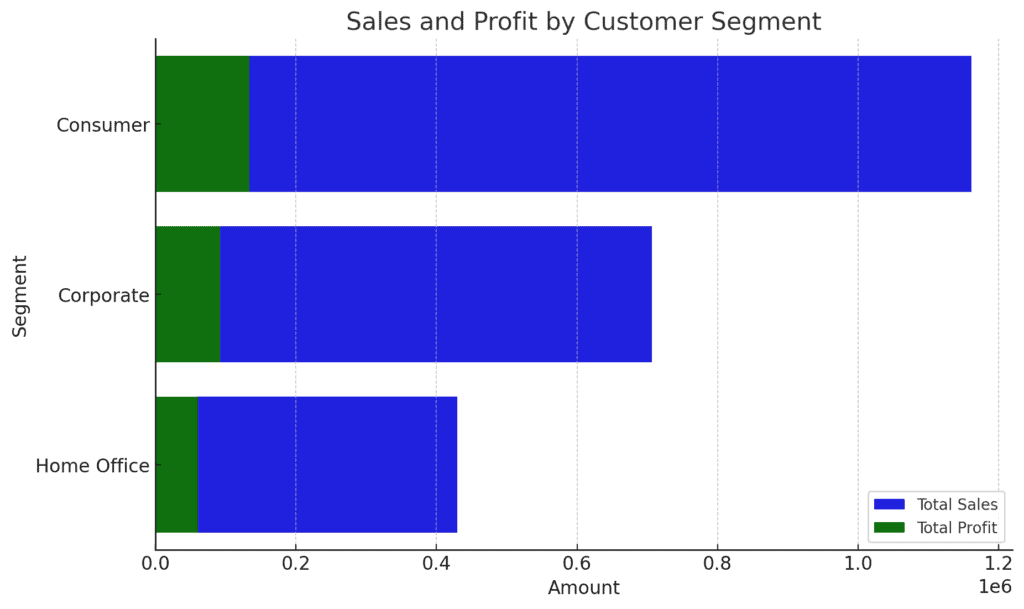
Insights:
- The Consumer segment drives the majority of the business, but the Corporate segment offers a high-profit margin and should not be overlooked in marketing and sales strategies.
- Further segmentation within these groups could reveal more targeted opportunities for growth.
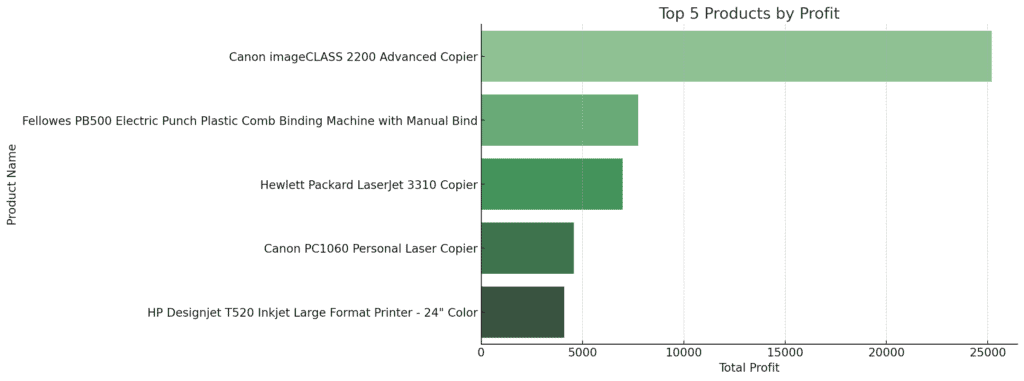
Product Performance Analysis
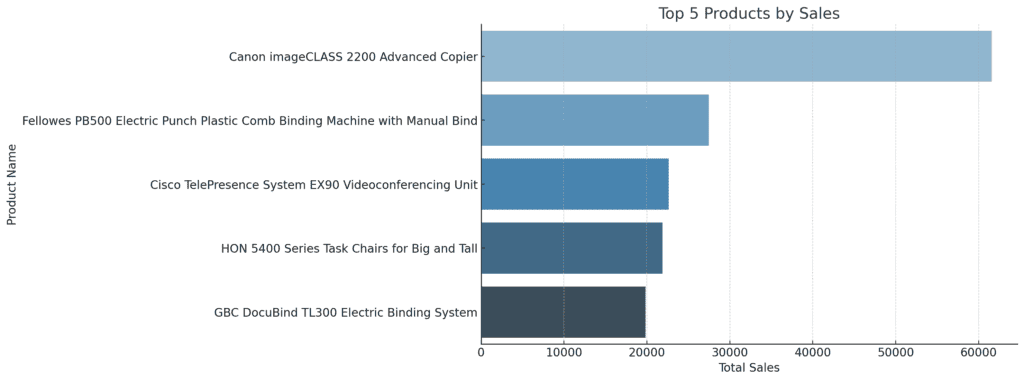
Top 5 Products by Sales:
- Canon imageCLASS 2200 Advanced Copier is the top-selling product with sales amounting to ~$61,600 and a substantial profit of ~$25,200.
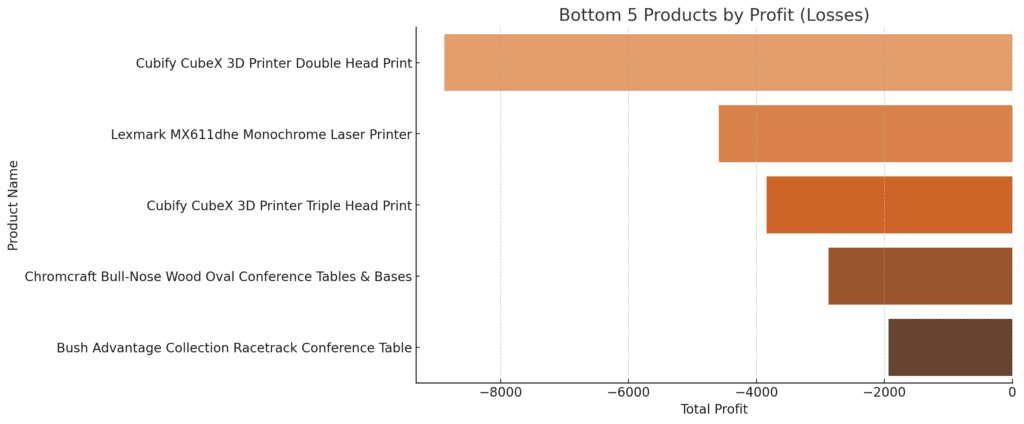
Bottom 5 Products by Sales:
- The products at the bottom of the sales are givenbythe bar chart below:
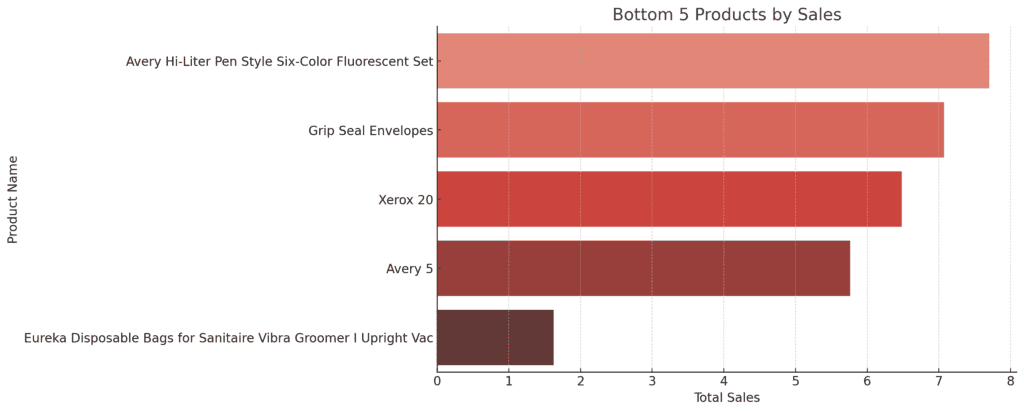
Insights:
- The analysis highlights a stark contrast between the top-selling products and those with minimal sales. Products like the Canon imageCLASS 2200 not only drive sales but also contribute significantly to profitability.
- The Cisco TelePresence System, despite high sales, operates at a loss, suggesting potential issues with pricing or cost management.
Correlation Analysis
Key Correlations:
- Sales and Profit: There is a moderate positive correlation ( 0.48~0.48 0.48) between sales and profit, indicating that higher sales generally lead to higher profits, but other factors may also influence profitability.
- Discount and Profit: There is a weak negative correlation ( −0.22~-0.22 −0.22) between discount and profit, suggesting that higher discounts are slightly associated with lower profits. This indicates that while discounts can drive sales, they can also erode profit margins if not managed carefully.
- Sales and Discount: There is a very weak negative correlation ( −0.03~-0.03 −0.03) between sales and discount, implying that discounts do not significantly impact sales volume in this dataset.
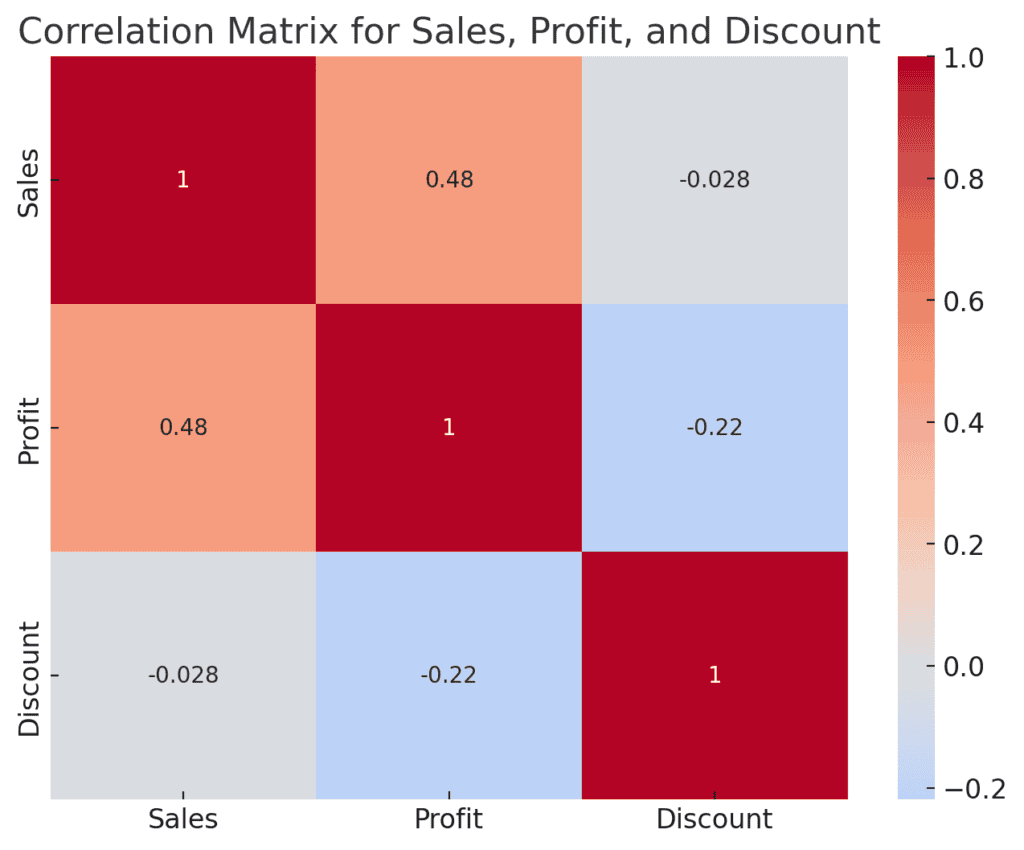
Insights:
- The moderate positive correlation between sales and profit highlights the importance of driving sales to enhance profitability. However, the negative correlation with discounts suggests a need for cautious discounting strategies to avoid profit erosion.
RFM (Recency, Frequency, Monetary) Analysis
RFM Metrics:
| Customer ID | Recency | Frequency | Monetary ($) |
| AA-10315 | 184 | 5 | 5563.56 |
| AA-10375 | 19 | 9 | 1056.39 |
| AA-10480 | 259 | 4 | 1790.512 |
| AA-10645 | 55 | 6 | 5086.935 |
| AB-10015 | 415 | 3 | 886.156 |
- Recency: Measures how recently a customer made a purchase. For example, Customer AA-10375 made a purchase 19 days ago.
- Frequency: Indicates the number of transactions a customer has made. For instance, Customer AA-10375 has made 9 purchases.
- Monetary: Represents the total amount of money spent by a customer. For example, Customer AA-10315 has spent ~$5,563.56.
Insights from RFM Analysis:
- Customers with low Recency, high Frequency, and high Monetary values are likely to be the most valuable customers.
- RFM analysis can be used to segment customers into different groups, such as “Loyal Customers,” “Potential Loyalists,” “At-Risk Customers,” etc.
Summary and recommendations
Sales and Profit Drivers:
- Technology and Furniture categories drive the most sales, with products like Phones and Chairs leading in profitability.
- Tables in the Furniture category, despite high sales, show a loss, indicating a need to review pricing or cost structures.
Geographical Insights:
- The West and East regions are the strongest performers. Efforts should focus on maintaining and growing market share in these regions.
- The Central region requires attention to improve profitability.
Customer Segmentation:
- The Consumer segment is the largest revenue generator, but Corporate customers offer strong profitability, suggesting a balanced focus on both segments.
Product Strategy:
- Top-selling products should continue to be promoted, but attention is needed on low-performing products, especially those with negative profitability.
Discounting Strategy:
- The weak negative correlation between discounts and profit suggests that while discounts can drive sales, they should be used judiciously to avoid profit erosion.
Customer Loyalty:
- RFM analysis reveals that certain customers are highly valuable and should be targeted with loyalty programs to maintain their business.
Conclusion
The analysis of the retail dataset provides a comprehensive understanding of the business’s performance across different dimensions.
By identifying top-performing products and regions, as well as analysing customer behaviour through RFM metrics, businesses can tailor their strategies to maximize profitability and customer satisfaction.
This analysis serves as a foundation for deeper exploration, enabling businesses to refine their strategies and achieve sustainable growth.