
How to predict heart disease treatment using Python
Introduction
Heart disease remains one of the leading causes of morbidity and mortality worldwide.
Hence, understanding the factors that contribute to heart disease and the treatments that can mitigate its effects is crucial for improving patient outcomes.
This project will explore a dataset related to heart attack patients and analyse various demographic, lifestyle, and clinical variables to uncover insights that could guide treatment decisions.
Machine learning techniques will be employed to predict treatment outcomes based on these variables and identify the key factors that influence treatment decisions.
Overview of the heart disease dataset
The dataset used in this analysis consists of 1,000 entries, each representing a patient who has experienced a heart attack.
The dataset for this analysis can be downloaded from this GitHub link and here. The Python code for the analysis can be downloaded here.
It contains eight columns that capture a mix of demographic, lifestyle, and clinical information as follows:
- Gender: The patient’s gender (Male or Female).
- Age: The patient’s age in years.
- Blood Pressure (mmHg): The patient’s blood pressure measured in millimetres of mercury.
- Cholesterol (mg/dL): The patient’s cholesterol level measured in milligrams per decilitre.
- Has Diabetes: Indicates whether the patient has been diagnosed with diabetes (Yes or No).
- Smoking Status: The patient’s smoking status (Never, Former, or Current).
- Chest Pain Type: The type of chest pain experienced by the patient (Typical Angina, Atypical Angina, Non-anginal Pain, or Asymptomatic).
- Treatment: The treatment received by the patient, which could be Lifestyle Changes, Angioplasty, Coronary Artery Bypass Graft (CABG), or Medication.
This dataset offers a comprehensive look at key factors that might influence the treatment approach for heart attack patients, providing a solid foundation for predictive analysis and insights into heart disease management.
Initial exploration
Summary Statistics for Numerical Variables
|
|
|
|
|
Age (Years) |
|
| 30 | 89 |
| 145.44 |
| 90 | 199 |
|
|
| 150 | 299 |
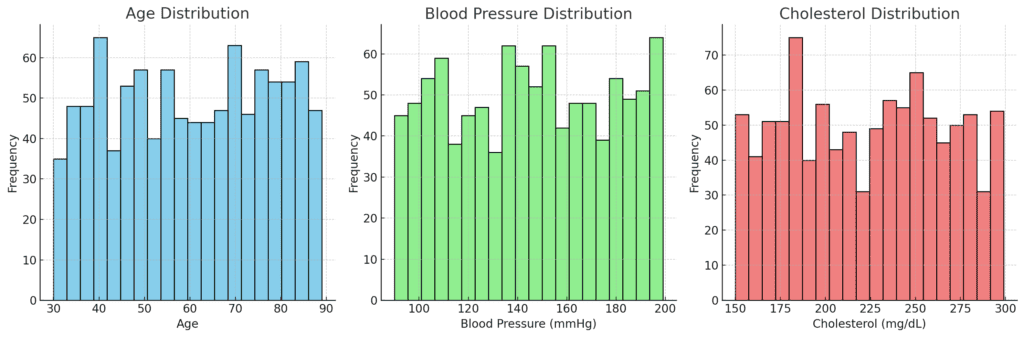
The patients are generally older, with a central age around 60 years. The wide age range suggests a diverse population in terms of age, which is important since age is a significant risk factor for heart disease.
The average blood pressure is slightly above the normal range, indicating that many patients may have hypertension, which is a common risk factor for heart attacks.
Cholesterol levels are relatively high on average, which is expected in a population with heart disease.
High cholesterol is another well-known risk factor for heart attacks.
Distribution of Categorical Variables
|
|
|
Gender | Female | 510 |
Gender | Male | 490 |
Has Diabetes | Yes | 517 |
Has Diabetes | No | 483 |
Smoking Status | Never | 352 |
Smoking Status | Current | 325 |
Smoking Status | Former | 323 |
Chest Pain Type | Non-anginal Pain | 261 |
Chest Pain Type | Asymptomatic | 255 |
Chest Pain Type | Typical Angina | 243 |
Chest Pain Type | Atypical Angina | 241 |
Treatment | Lifestyle Changes | 269 |
Treatment | Coronary Artery Bypass Graft (CABG) | 252 |
Treatment | Angioplasty | 247 |
Treatment | Medication | 232 |
- The data seems to suggest a nearly equal distribution of male and female patients. This tends to allow for gender-based comparisons in treatment and outcomes.
- Slightly more than half of the patients have diabetes, indicating a significant overlap between diabetes and heart disease in this population.
- The smoking status is fairly evenly distributed, with a slight majority never having smoked. However, the presence of current and former smokers highlights smoking as a notable risk factor in this group.
- The chest pain types indicate a variety of clinical presentations among heart attack patients. This does suggest that chest pain type may be an important variable in understanding and predicting treatment outcomes.
- The even distribution of treatment seems to indicate a balanced approach to treatment decisions. This could make for a suitable modelling and predictive analysis without bias toward a particular treatment type.
Further analysis
Correlation Analysis
Let’s identify the relationships between numerical variables using the matrix below:
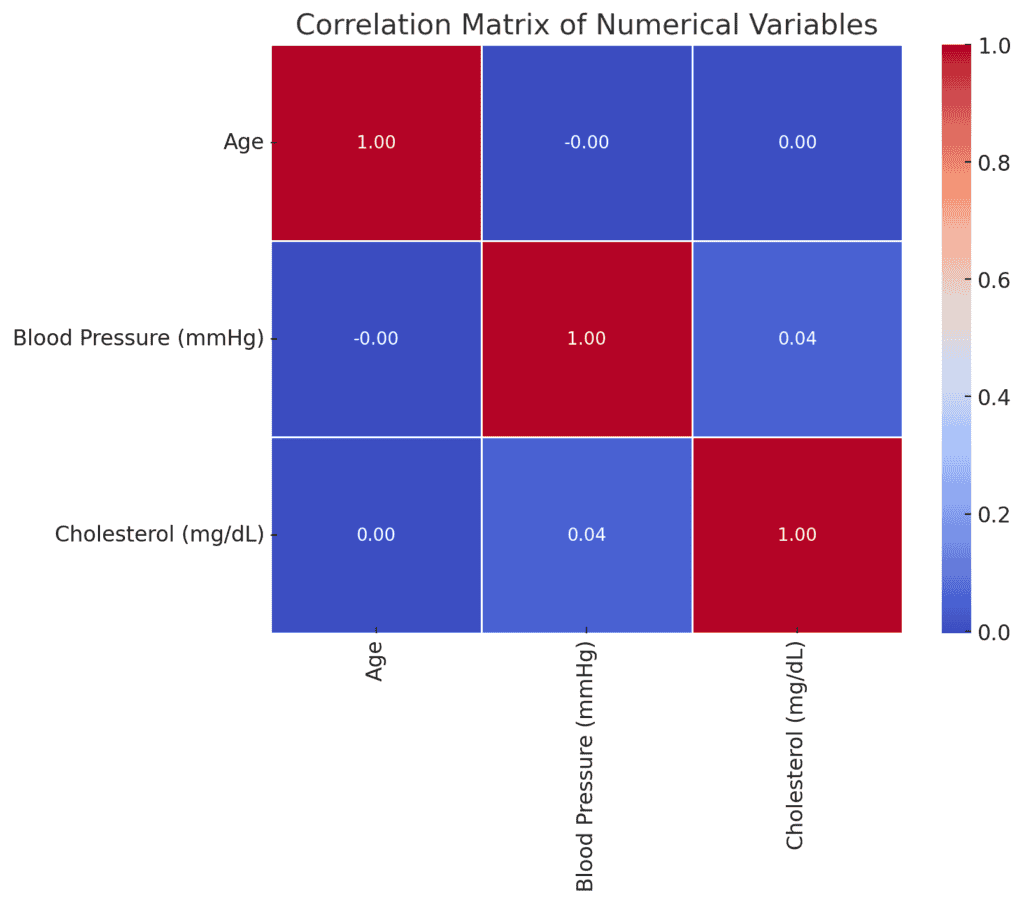
The correlation matrix shows the following relationships among the numerical variables:
Age
No significant correlation with either blood pressure or cholesterol.
Blood Pressure (mmHg)
A very weak positive correlation with cholesterol (0.044).
Cholesterol (mg/dL)
Essentially no correlation with age or blood pressure.
Generally, the weak correlations indicate that, within the dataset, age, blood pressure, and cholesterol levels are largely independent of one another.
This suggests that these variables may not be strong predictors of each other in this context.
Given the low correlations among the numerical variables, it may be more insightful to explore relationships between categorical variables and outcomes, such as treatments.
We will proceed with a Chi-Square Test for independence among categorical variables, particularly focusing on relationships like:
- Smoking Status and Treatment
- Has Diabetes and Treatment
- Gender and Treatment
This will help determine if any significant associations exist between these variables.
Chi-Square Test
Chi-Square tests were conducted to examine the relationships between categorical variables and treatment types. Below are the results:
| Test | Chi2 | p-value | Degrees of Freedom |
| Smoking Status vs Treatment | 1.7973 | 0.9373 | 6 |
| Has Diabetes vs Treatment | 0.8026 | 0.8488 | 3 |
| Gender vs Treatment | 0.8967 | 0.8262 | 3 |
As could be observed, none of the categorical variables (Smoking Status, Has Diabetes, Gender) seem to show a statistically significant relationship with the treatment type.
This suggests that in the dataset, treatment decisions are likely based on factors other than these demographic and lifestyle variables, or that these factors are equally distributed across different treatments.
Now let’s consider a predictive modelling using machine learning to determine the treatment that can be administered given the variables in the dataset.
Predictive Modelling Approach
Now we will proceed with a simple predictive modelling approach by adopting the following procedure.
Details of the Python coding used are provided in the link provided at the beginning of this project.
Data Preparation
- Encode categorical variables into numerical values since machine learning models typically require numerical input.
- Split the dataset into features (X) and the target variable (y) which, in this case, will be the Treatment column.
- Split the data into training and testing sets to evaluate the model’s performance.
Model Selection
- We will use the Random Forest classifier, which is considered robust and provides feature importance that can help in interpreting the model.
Model Training and Evaluation
- Train the model on the training set and evaluate its performance on the test set.
- Metrics to be used: Accuracy, Precision, Recall, F1-Score, and possibly the ROC-AUC score and confusion matrix.
Feature Importance
- Analyse which features are most important in predicting the treatment type.
Predictive Modelling Results
The Random Forest model was trained and evaluated on the test set. Here are the key results:
|
|
|
|
|
Angioplasty | 0.24 | 0.25 | 0.24 | 69 |
Coronary Artery Bypass Graft (CABG) | 0.28 | 0.32 | 0.3 | 75 |
Lifestyle Changes | 0.25 | 0.29 | 0.27 | 78 |
Medication | 0.35 | 0.23 | 0.28 | 78 |
macro avg | 0.28 | 0.27 | 0.27 | 300 |
weighted avg | 0.28 | 0.27 | 0.27 | 300 |
Classification Report
- Accuracy, Precision, Recall, and F1-Scores:
- The accuracy is 27.33% while the precision, recall, and F1-scores are around 0.24 to 0.35 for all treatment categories, indicating that the model’s predictions are not highly reliable.
- The accuracy is 27.33% while the precision, recall, and F1-scores are around 0.24 to 0.35 for all treatment categories, indicating that the model’s predictions are not highly reliable.
- Support:
- The number of instances for each treatment in the test set is fairly balanced.
- The number of instances for each treatment in the test set is fairly balanced.
- ROC-AUC Score: 0.524
- The ROC-AUC score is slightly better than random guessing (which would be 0.5), but still indicates weak predictive power.
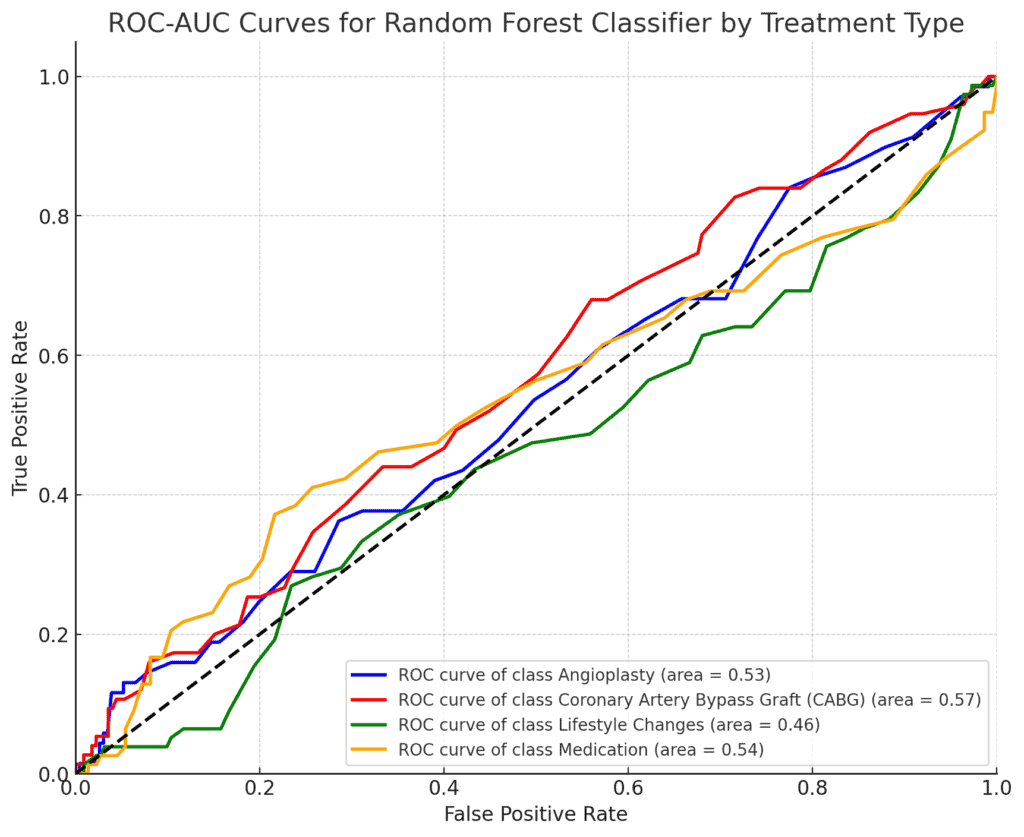
The low accuracy and ROC-AUC score indicate that the Random Forest model is not effectively capturing the patterns needed to predict the treatment type.
This might suggest that the features provided are not strong predictors for treatment decisions, or that more complex interactions between variables need to be considered.
Confusion Matrix
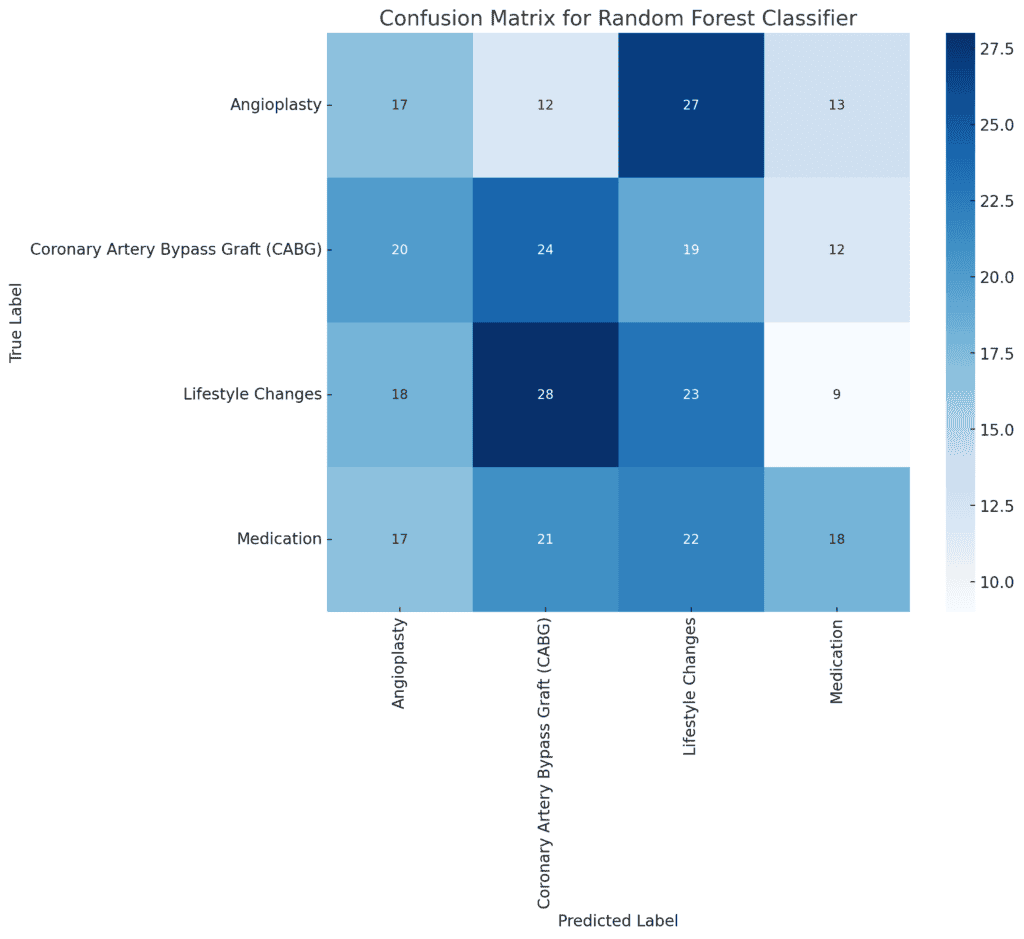
- True Positives (Diagonal Values):
These represent cases where the model correctly predicted the treatment type (e.g., 17 true positives for “Angioplasty”).
- False Positives (Off-Diagonal Values in Columns):
These occur when the model incorrectly predicts a treatment type that is not the actual treatment (e.g., 14 cases were incorrectly predicted as “Angioplasty” when they were another type).
- False Negatives (Off-Diagonal Values in Rows):
These occur when the model fails to predict the actual treatment type, instead predicting something else (e.g., 16 cases of “Angioplasty” were incorrectly predicted as other treatments).
Key Observations
- The confusion matrix shows that the model has some difficulty distinguishing between treatment types, as indicated by the number of off-diagonal values.
- There is no single class that the model predicts very well, indicating that improvements could be made either by refining the model or adjusting the features.
Analysis of Feature Importance
Even though the model’s performance is not strong, analysis of feature importance could provide insights into which variables, if any, have a larger influence on the prediction.
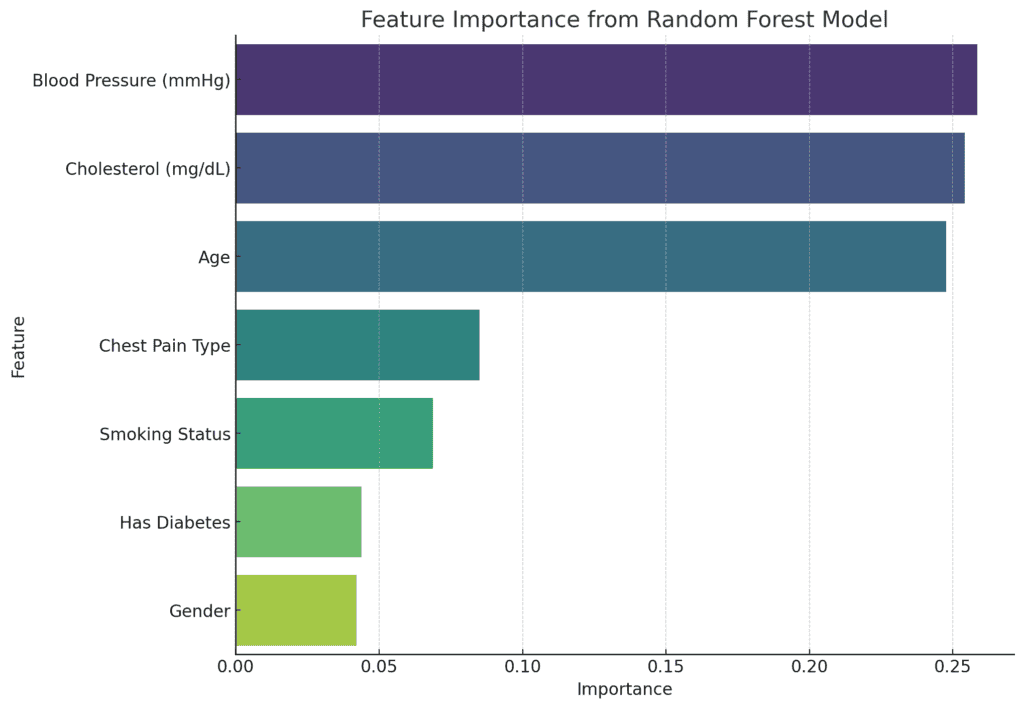
The feature importance extracted from the Random Forest model shows the relative contribution of each feature in predicting the treatment type:
Top Features:
- Blood Pressure (mmHg): 25.84%
- Cholesterol (mg/dL): 25.42%
- Age: 24.76%
These three numerical variables are the most significant in predicting the treatment type, collectively accounting for about 75% of the model’s decision-making process.
Less Important Features:
- Chest Pain Type: 8.51%
- Smoking Status: 6.87%
- Has Diabetes: 4.38%
- Gender: 4.21%
The categorical variables seem to have a relatively minor influence on the model’s predictions, consistent with the earlier Chi-Square test results.
Nevertheless, the dominance of numerical features like blood pressure, cholesterol, and age suggests that these health metrics play a larger role in determining the treatment type compared to lifestyle factors like smoking status or the presence of diabetes.
Summary and recommendations
Given this is only a beginner-level project, further analysis could be carried out to improve the performance of a predictive modelling most especially.
The following suggestions could be adopted for future analysis:
Expand the Dataset
- Incorporate Additional Features: To improve the model’s predictive power, consider adding more variables such as family history of heart disease, exercise habits, dietary information, stress levels, and medication adherence. These factors can provide a more holistic view of the patient’s health and contribute to better predictions.
- Increase Sample Size: A larger dataset with more patient records could enhance the model’s ability to generalise and improve the robustness of the analysis.
Model Refinement
- Explore Advanced Models: While the Random Forest model provided some insights, exploring more advanced models such as Gradient Boosting Machines (GBM), XGBoost, or deep learning models could yield better performance.
- Hyperparameter Tuning: Optimise the performance of the Random Forest model through hyperparameter tuning using techniques like grid search or randomised search to identify the best combination of parameters.
Feature Engineering
- Create Interaction Terms: Explore potential interactions between variables (e.g., the interaction between age and cholesterol levels) to capture more complex relationships that might impact treatment decisions.
- Categorical Feature Encoding: Experiment with different encoding techniques, such as one-hot encoding or target encoding, to better handle categorical variables and improve model interpretability.
Model Interpretability
- Utilise SHAP Values: Implement SHAP (SHapley Additive exPlanations) values to provide more detailed insights into how individual features contribute to the model’s predictions, helping to explain why certain treatment decisions are made.
- Decision Tree Visualisation: Consider visualising individual decision trees within the Random Forest to better understand the decision-making process for different patient profiles.
Conclusion
Our exploration of the heart attack dataset using the Random Forest classifier reveals that while traditional health metrics like blood pressure, cholesterol, and age play a significant role in determining treatment outcomes, the predictive power of the model remains modest.
The analysis highlights the complexity of treatment decisions, suggesting that factors beyond the available data may influence these decisions.
Although the model’s performance was limited, the feature importance analysis provides valuable insights into which variables are most influential.
This analysis underscores the need for more comprehensive data and advanced modelling techniques to improve predictions and ultimately enhance patient care.